AWS Step Functions Monitoring
AWS Step functions enables you to coordinate work across various distributed components by expressing workflow as state machines and tasks. With Site24x7's AWS integration you can monitor and alert on metrics like Execution time and more to understand the behavior of your state machines.
Setup and configuration
- If you haven't done it already, enable Site24x7 access to you AWS resources by creating a cross-account IAM role between your AWS account and Site24x7's AWS account. You can also create Site24x7 as an IAM user and generate security credentials. Learn more
- In the Integrate AWS Account page, select step functions in the services to be discovered section.Learn more.
Policies and Permissions
Assign the AWS managed policy ReadOnlyAccess to the Site24x7 entity (IAM role or IAM user) to help Site24x7 access and collect information about your state machines. If you're assigning a custom policy, please make sure the following read-level actions are present in the policy JSON. Learn more.
- "states:ListStateMachines",
- "states:DescribeStateMachine",
- "states:ListActivities",
- "states:DescribeExecution",
- "states:ListExecutions",
- "states:GetExecutionHistory",
- "states:ListTagsForResource"
Polling frequency
Site24x7 collects metric data points about step function execution as per the poll frequency set (1 minute to a day).Learn more.
IT Automations
You can add automations for the AWS services supported by Site24x7. Log in to Site24x7 and go to Admin > IT Automation Templates (+) > Add Automation Templates. Once automations are added, you can schedule them to be executed one after the other.
You can now start a state machine execution using AWS Step function automations.
Licensing
Each step function is considered a basic monitor. Learn more.
Supported metrics
| Attribute | Description | Data type | Statistics |
|---|---|---|---|
| Execution time | Measures the interval, between the time the execution starts and the time it ends. | Seconds | Average |
| Execution Throttled | Measures the number of times state entered events and retries have been throttled. | Count | Sum |
| Executions Aborted | Measures the number of aborted or terminated executions. | Count | Sum |
| Executions Failed | Measures he number of failed executions. | Count | Sum |
| Executions Started | Measures the number of started executions. | Count | Sum |
| Executions Succeeded | Measures the number of successfully completed execution. | Count | Sum |
| Execution Timed out | Measures the number of executions that timed out for any reason. | Count | Sum |
Forecast
Estimate future values of the following performance metrics and make informed decisions about adding capacity or scaling your AWS infrastructure.
- Execution Time
- Execution Throttled
- Executions Failed
- Execution Timed Out
To view data
- Sign in to the Site24x7 web console. On the left navigation pane, choose AWS and choose your monitored AWS account.
- In the menu dropdown, choose Step Functions.
- From the list of monitored state machines, choose the state machine for which you want to see metrics.
AWS Step Functions Monitoring Interface
Summary
Use the Summary tab to gain insight into your step function executions. By default, time series charts for all state machine metrics are displayed.
Work Flow Graph
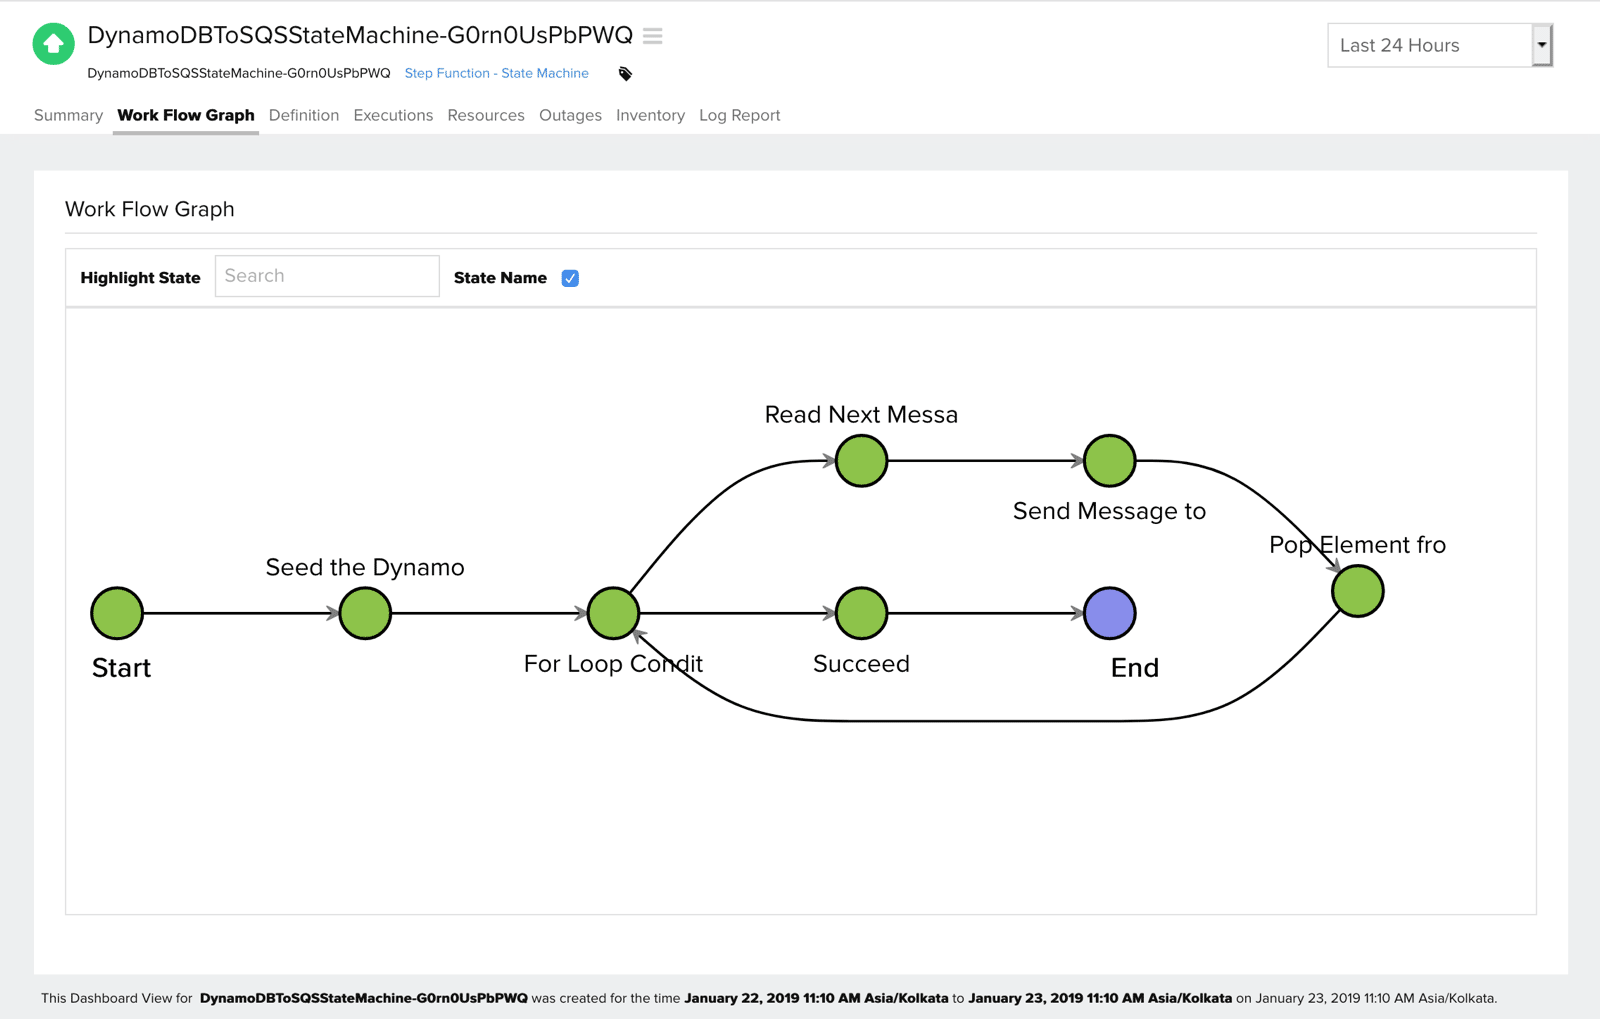
A color-coded visual workflow of your state machine is displayed. You can hover over each state to view more information. For example, when you mouse over a failed state, you can see what run time error caused the failure along with the service name of the called resource and the action of the resource.

Definition
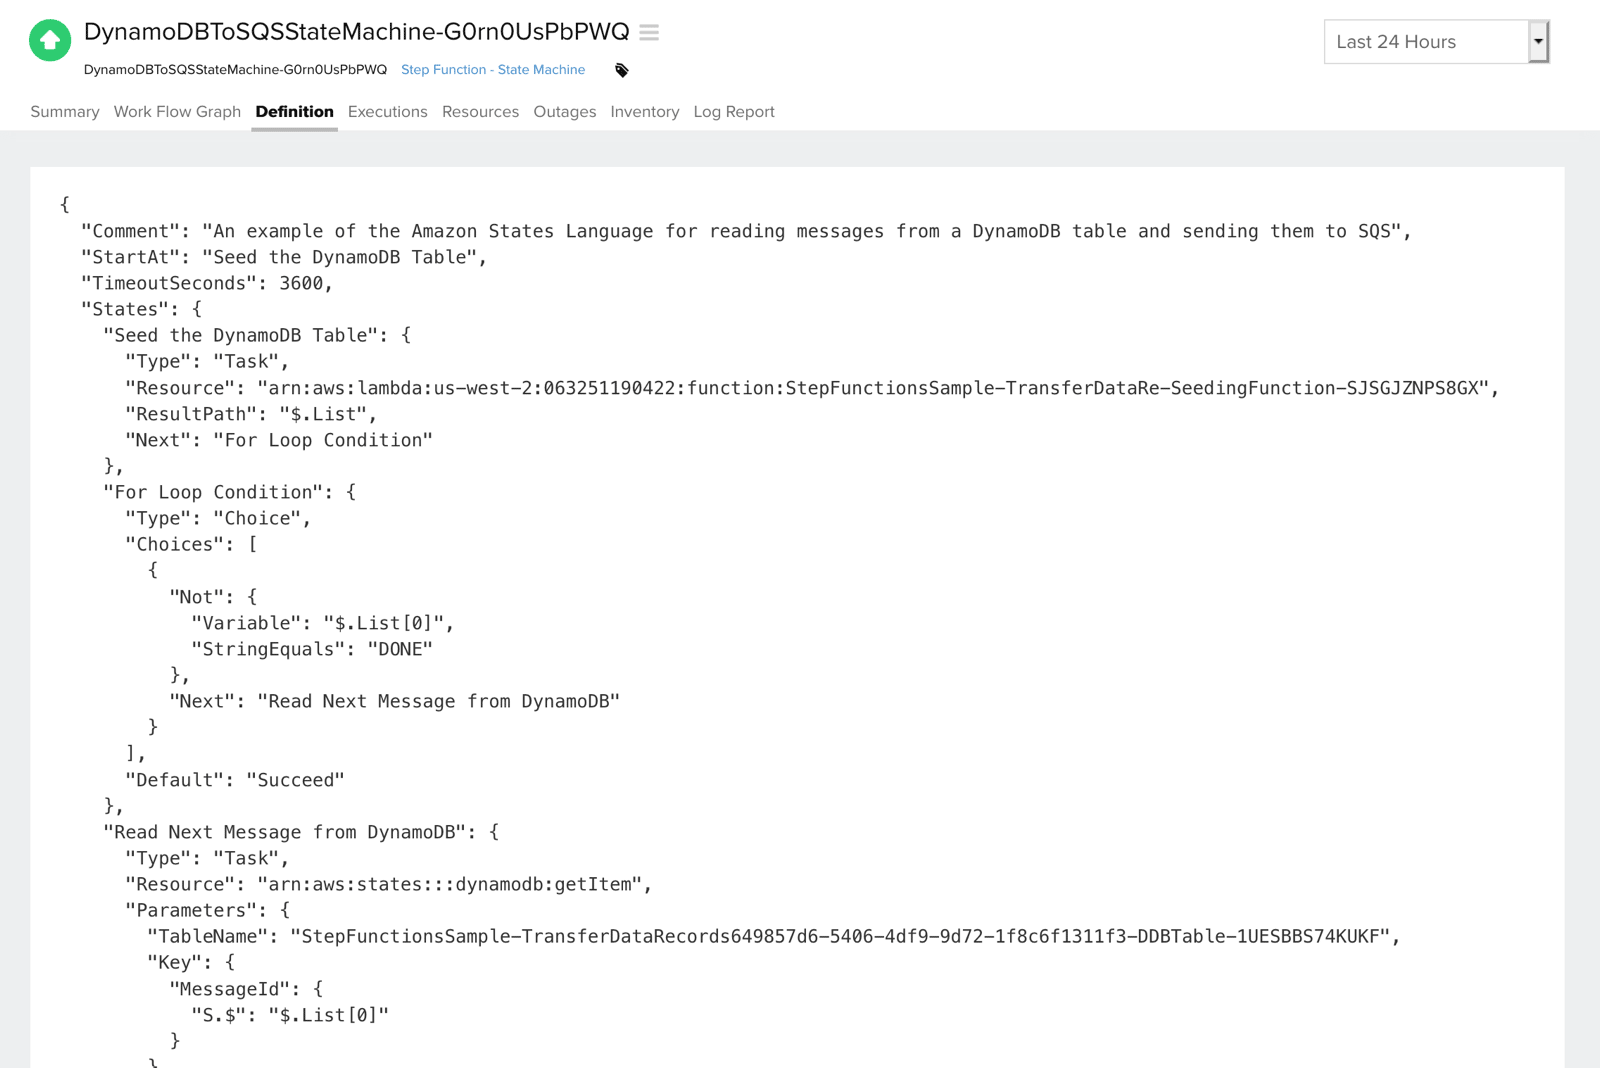
The Amazon States language (JSON based structured language) definition of the state machine is shown.

Executions
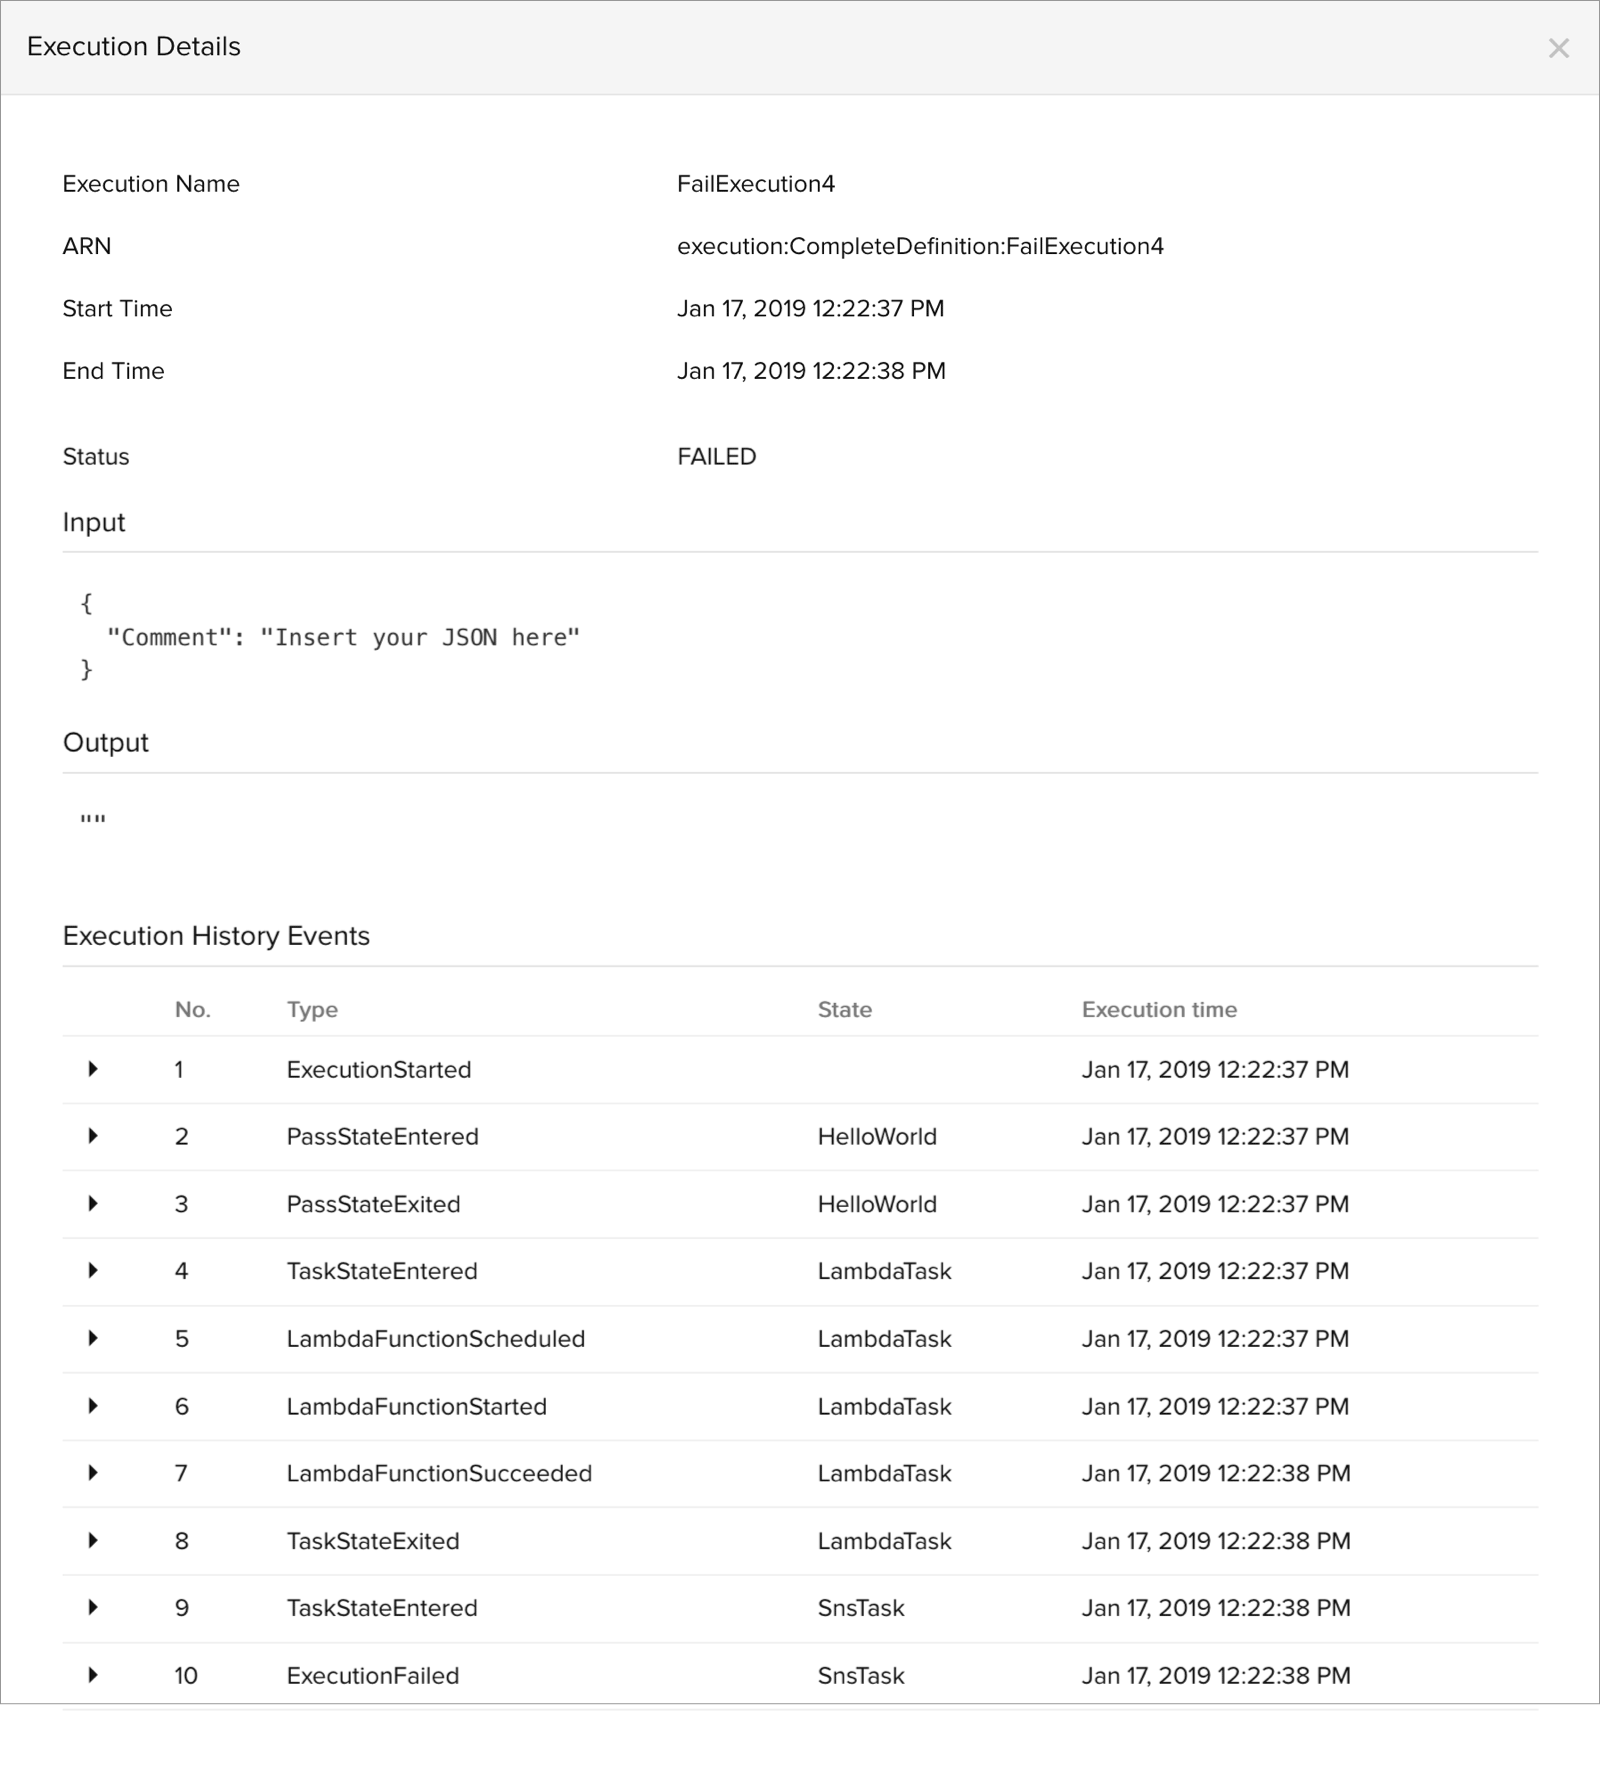
The state machine execution history is displayed in reverse chronological order. You can choose a specific execution to view the list of events that occurred in that execution along with time stamp, JSON data input, type, state details and more.

Resources
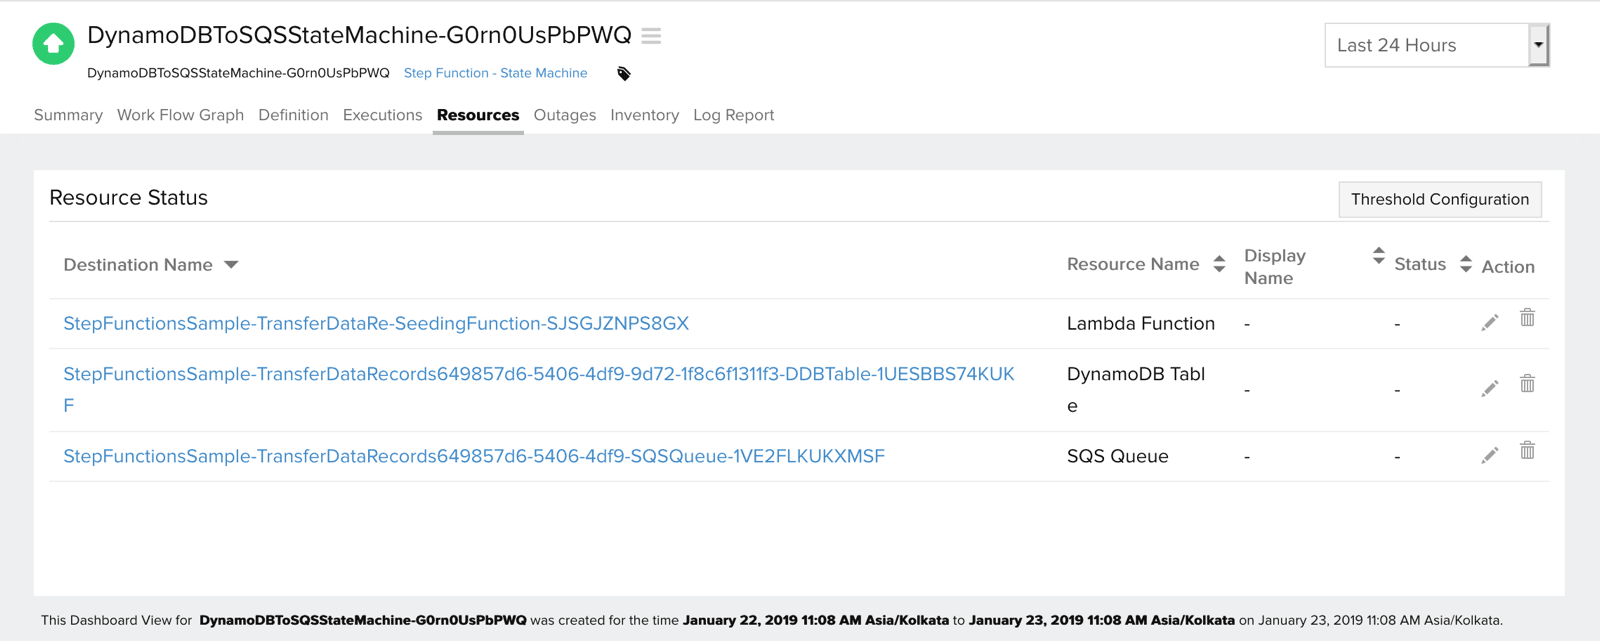
The AWS resources—DynamoDB tables, SNS topics, Lambda, ECS, and SQS queues— referenced in your state machine activities are displayed along with their status (Note: The resource status would only be shown if it is monitored by Site24x7). You can also set thresholds and be notified when any of these services fail by clicking the pencil icon under Action.

Topology View
The Topology View tab delivers a live, resource-centric dependency map. It dynamically traces how your Step Function resource is connected to its surrounding AWS infrastructure in real time, enabling faster root cause isolation when alerts fire. If any connected component is in a Critical state, it is marked accordingly within the topology view, along with the outage reason, so you can pinpoint the exact failure point without needing to navigate away from the monitor page. Unlike account-wide topology views, this tab scopes visualization to a single resource, answering the precise question: What does this Step Function resource connect to, and what breaks if it does?You can trace the full dependency chain from the individual resource up through its primary parent entities to the Service type, Region, and AWS account levels.
