Azure Virtual Machine Scale Set Monitoring Integration
Azure Virtual Machine Scale Sets help you construct and manage a group of load-balanced VMs. The number of VM instances can be increased or decreased automatically in response to demand or on a predefined schedule. These VM scale sets give your applications high availability while allowing you to manage, configure, and upgrade a large number of VMs from a single location.
You can now monitor your VM scale sets with precise metrics, define thresholds, automate tasks, and stay on top of outages with Site24x7's integration.
Setup and configuration
You can add Azure Virtual Machine Scale Sets while adding a new monitor or you can add it to an existing Azure monitor. Follow these steps to add the service.
Supported metrics
The following metrics are collected:
| Metric name | Description | Statistic | Unit |
|---|---|---|---|
|
CPU Credits Consumed |
The total number of credits consumed by the VM. Only available on B-series burstable VMs |
Average |
Count |
|
CPU Credits Remaining |
The total number of credits available to burst. Only available on B-series burstable VMs |
Average |
Count |
|
Disk Read Bytes |
Bytes read from the disk during the monitoring period |
Total |
Bytes |
|
Disk Read Operations/Sec |
Disk input operations per second (IOPS) |
Average |
Count per second |
|
Disk Write Bytes |
Bytes written to the disk during the monitoring period |
Total |
Bytes |
|
Disk Write Operations/Sec |
The number of disk write IOPS |
Average |
Count per second |
|
Inbound Flows |
The number of current flows in the inbound direction (the traffic going into the VM) |
Average |
Count |
|
Network In |
The number of billable bytes received on all network interfaces by the VM(s) |
Total |
Bytes |
|
Network Out |
The number of outbound billable bytes on all network interfaces by the VMs (deprecated) |
Total |
Bytes |
|
OS Disk Queue Depth |
The depth or the length of the OS disk queue |
Average |
Count |
|
OS Disk Read Bytes/sec |
Bytes read from a single disk during the monitoring period for an OS disk |
Average |
Count per second |
|
OS Disk Read Operations/Sec |
Read IOPS from a single disk during the monitoring period for an OS disk |
Average |
Count per second |
|
OS Disk Write Bytes/sec |
Bytes written to a single disk during the monitoring period for an OS disk |
Average |
Count per second |
|
OS Disk Write Operations/Sec |
Write IOPS from a single disk during the monitoring period for an OS disk |
Average |
Count per second |
|
Outbound Flows |
The number of current outbound flows (the traffic going out of the VM) |
Average |
Count |
|
Data Disk Queue Depth |
The depth or the length of the data disk queue |
Average |
Count |
|
Data Disk Read Bytes/sec |
Bytes read from a single disk during the monitoring period |
Average |
Count per second |
|
Data Disk Read Operations/Sec |
Read IOPS from a single disk during the monitoring period |
Average |
Count per second |
|
Data Disk Write Bytes/sec |
Bytes written to a single disk during the monitoring period |
Average |
Count per second |
|
Data Disk Write Operations/Sec |
Write IOPS from a single disk during the monitoring period |
Average |
Count per second |
|
Percentage CPU |
The percentage of allocated compute units that are currently in use by the VM(s) |
Average |
Percentage |
Threshold configuration
Global configuration
- Go to the Admin section in the left navigation pane.
- Select Configuration Profiles from the left pane and choose the Threshold and Availability (+) tab from the drop-down menu. Click Add Threshold Profile from the top-right corner.
- Set the monitor type as Azure Virtual Machine Scale Sets. Now you can set the threshold values for all the metrics mentioned above.
Monitor-level configuration
- Go to Cloud > Azure and select Azure Virtual Machine Scale Sets from the drop-down menu.
- Choose a resource for which you would like to set a threshold, then click the hamburger icon
 . Select Edit, which will direct you to the Edit Azure Virtual Machine Scale Sets Monitor page.
 - You can set the threshold values for the metrics by selecting Threshold and Availability. You can also configure IT Automation at the attribute level.
IT Automation
Site24x7 offers a set of exclusive IT Automation tools to auto-resolve performance degradation issues. These tools react to events proactively rather than waiting for manual intervention.
How to configure IT Automation for a monitor
Configuration Rules
With Site24x7's Configuration Rules, you can set parameters like Threshold Profile, Notification Profile, Tags, and Monitor Group for multiple monitors.
How to add a Configuration Rule
Site24x7's Virtual Machine Scale Set monitoring interface
Get an overview of the availability and usage status of your Virtual Machine Scale Set.
Summary
The Summary tab will help you view metrics such as Data Disk Read and Write Bytes, Data Disk Read and Write Operations, Data Disk Queue Depth, and more.
Configuration Details
The Configuration Details tab provides the configuration details of your Virtual Machine Scale Set. Details on the Orchestration Mode, Provisioning State, Storage and Network Profile, and more are included in this section.
Dimension Metrics
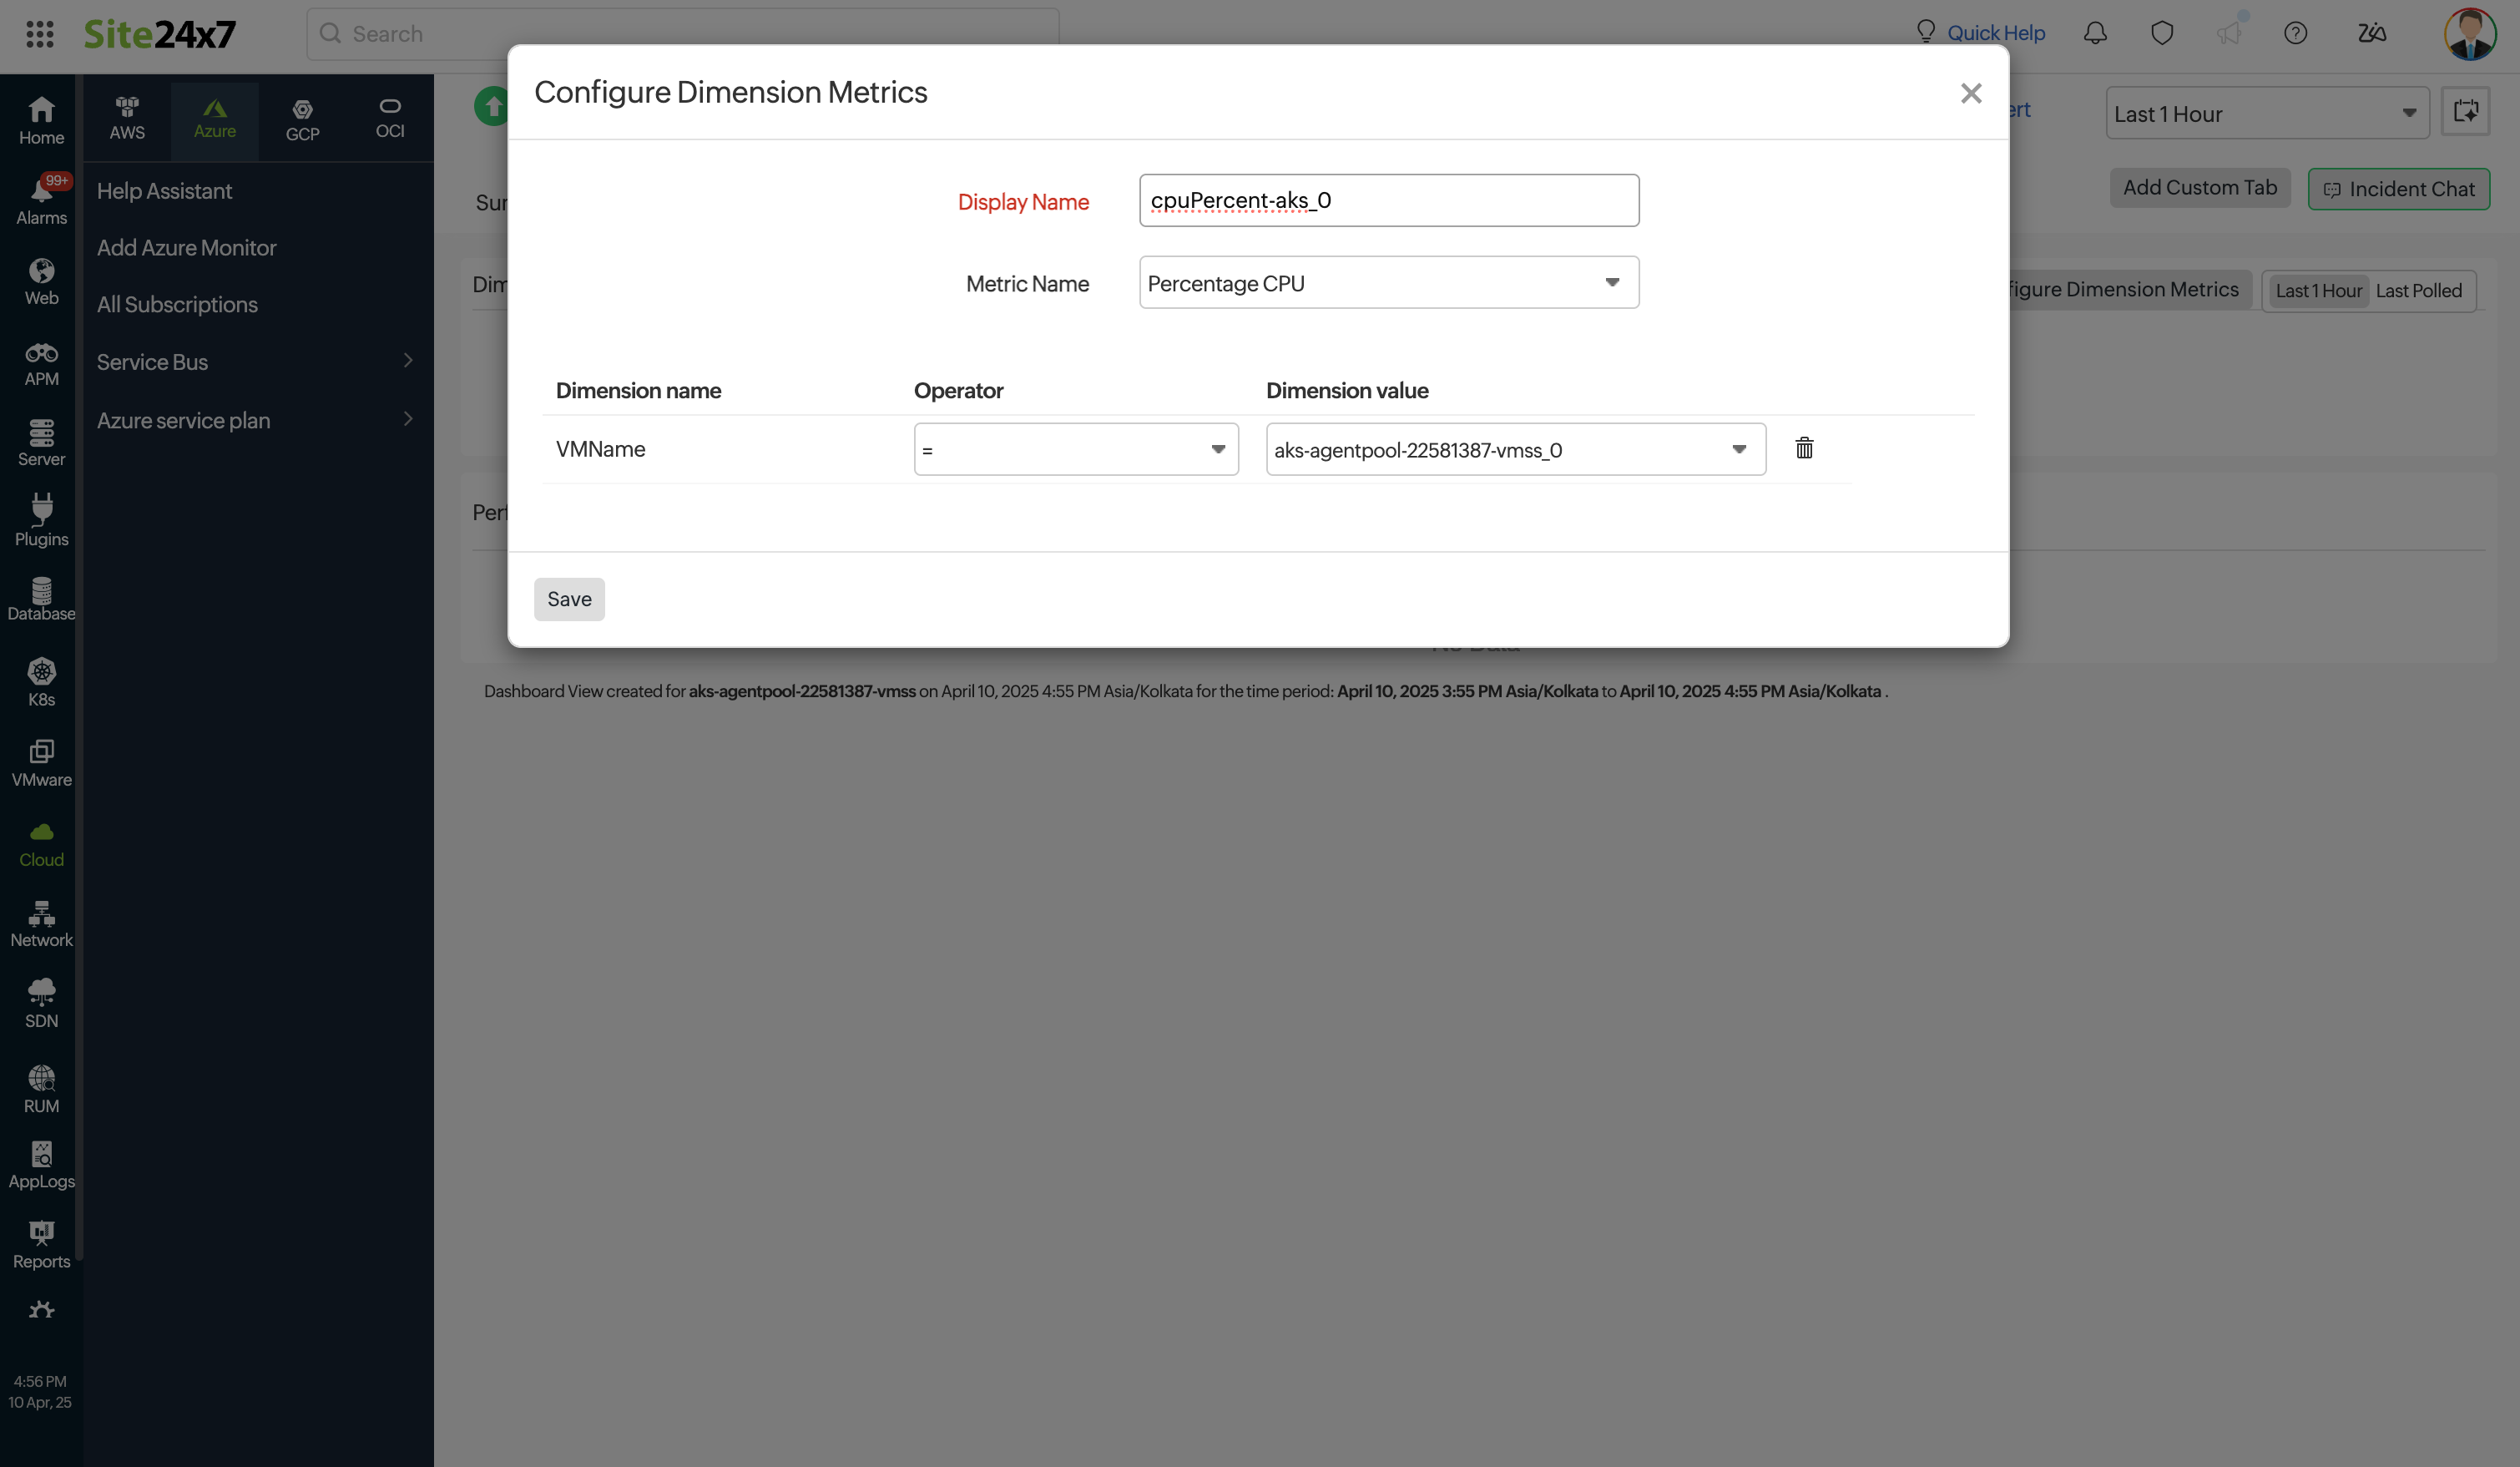
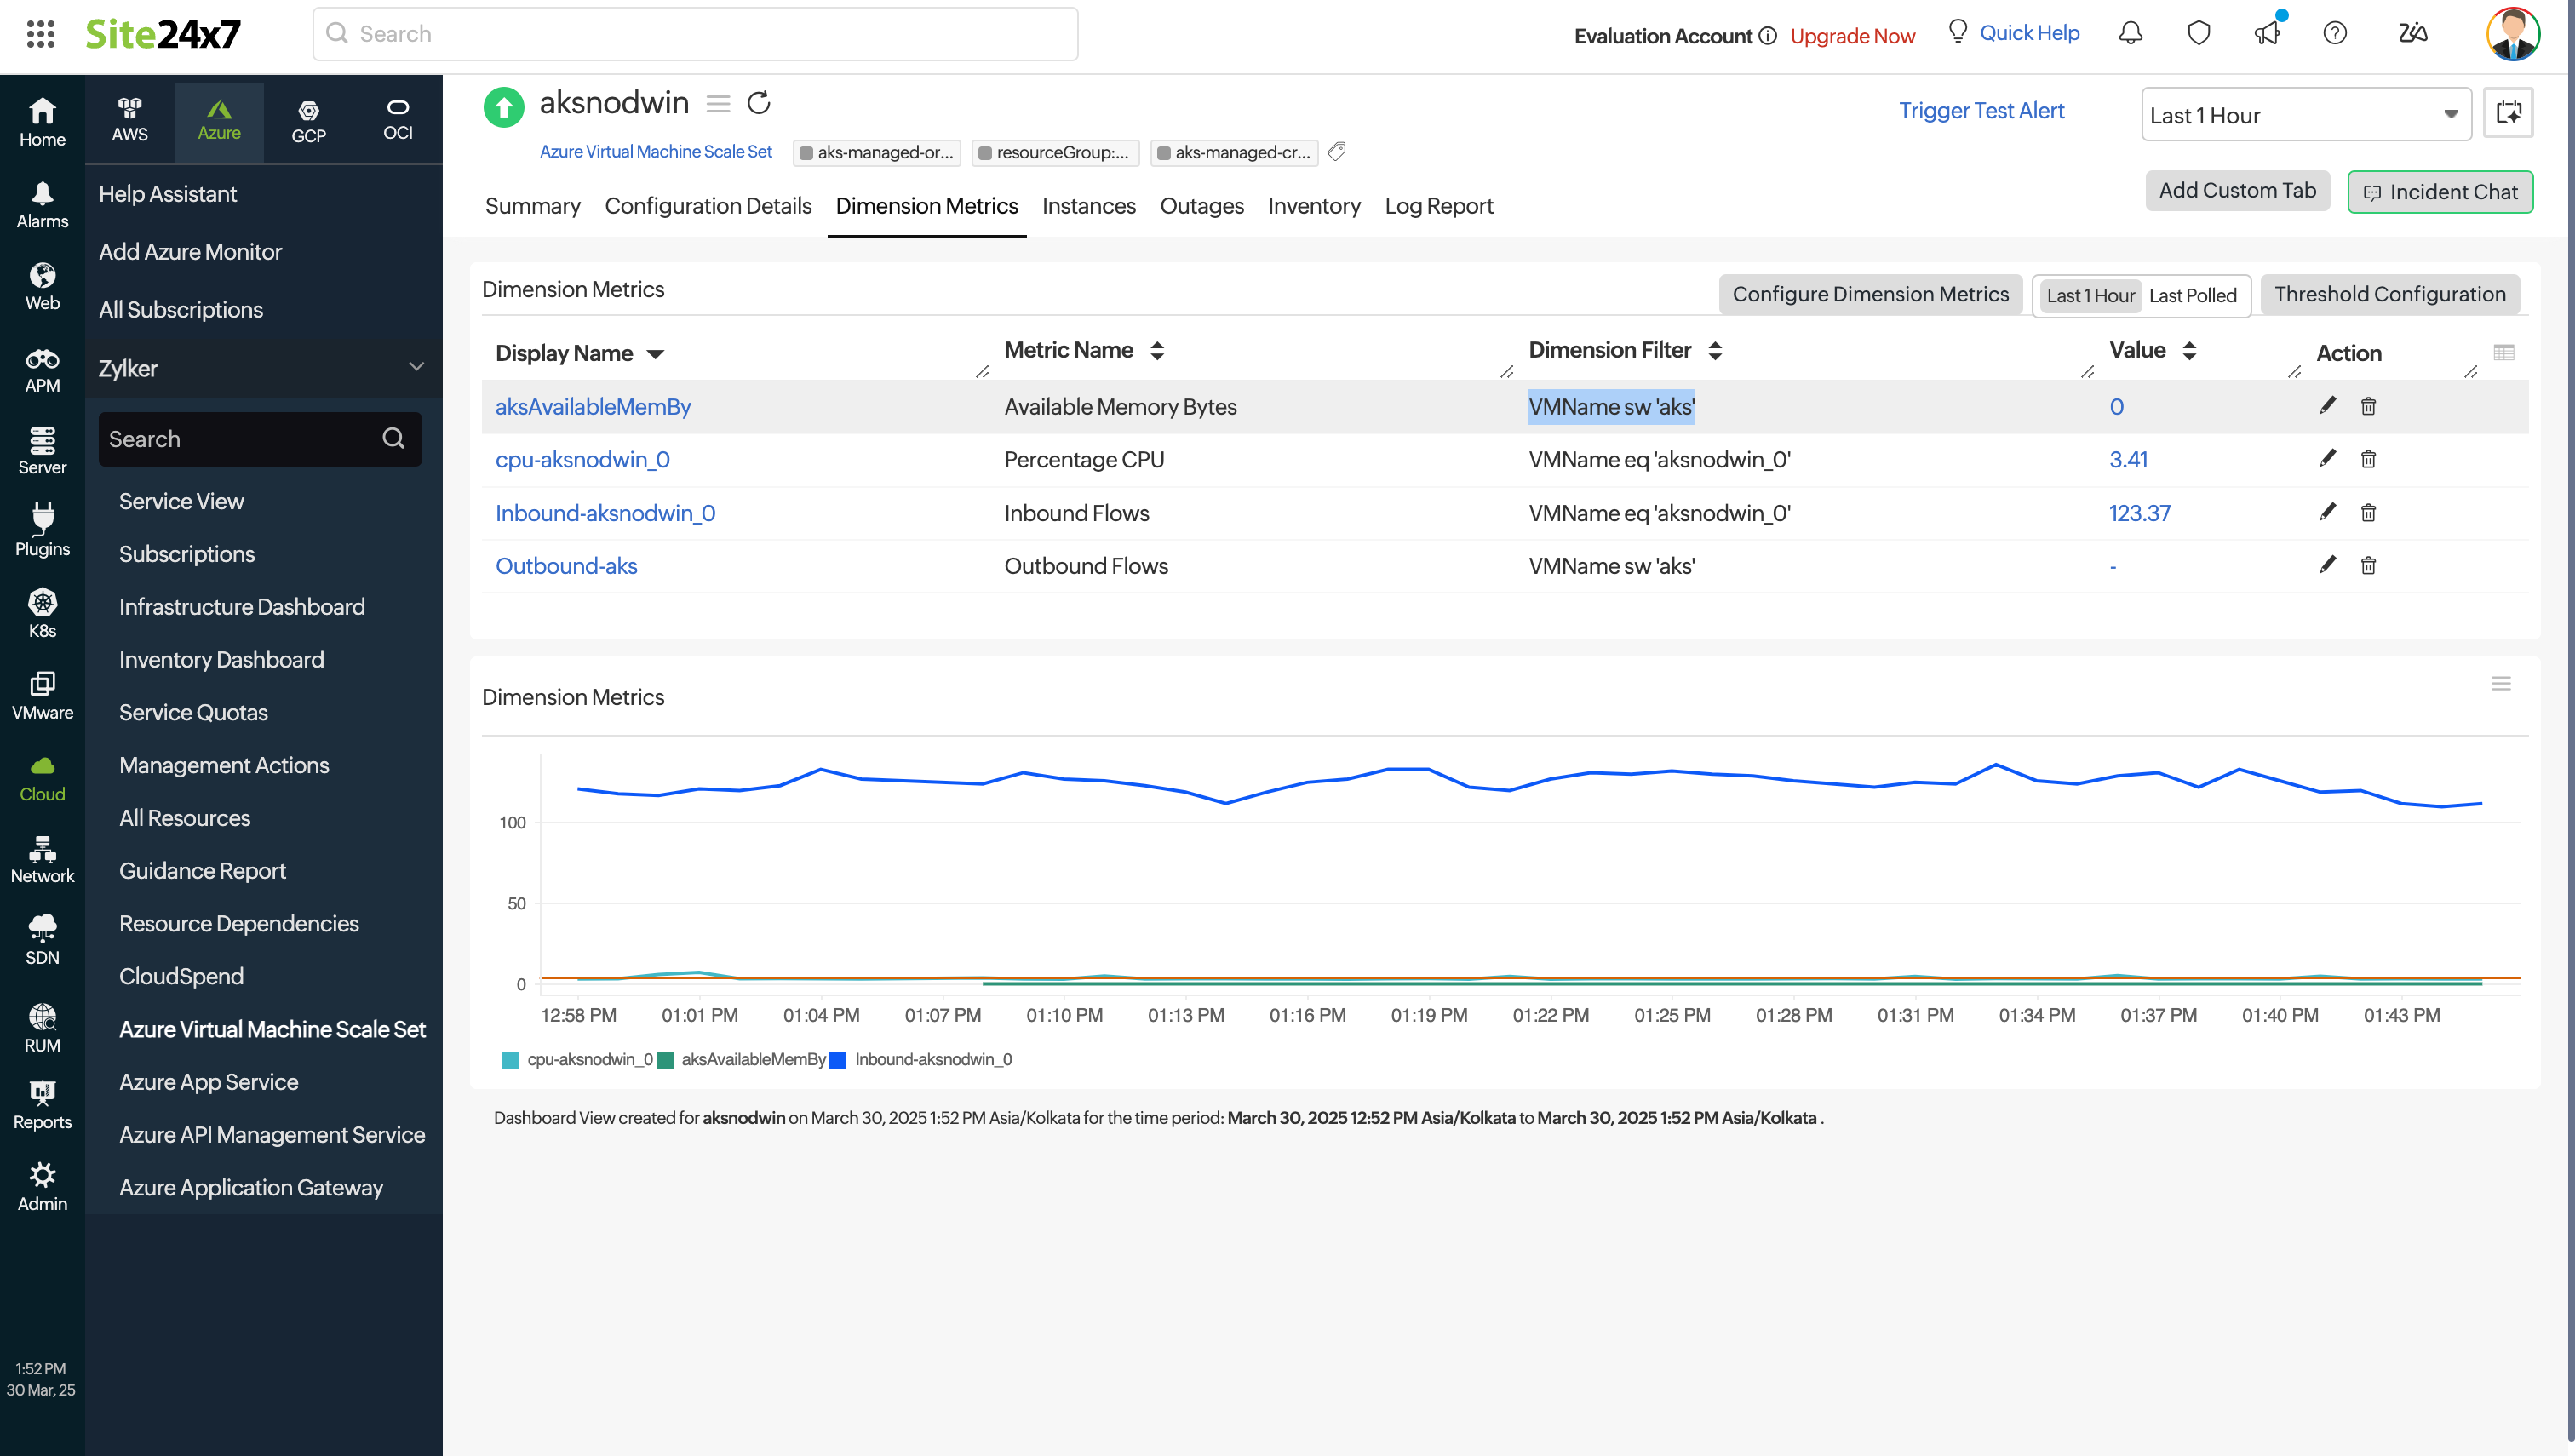
Configure Dimension Metrics to view the dimension metric information. Get alerts by applying the respective dimension filter and configuring thresholds for them. You can apply thresholds in bulk for the metrics. Edit and delete the monitored dimension metrics using the Action option. You can also fetch the various dimensions for a preferred metric by providing the Dimension value while configuring the dimension metric. You can monitor up to 25 dimension metrics.


Instances
This tab lists the instances in your Virtual machine Scale Set along with the percentage of CPU used and the incoming and outgoing network information.
Outages
The Outages tab provides the history of the Virtual Machine Scale Set statuses, including Down, Trouble, and Critical.
Inventory
The Inventory tab provides details on licensing, threshold and availability profiles, the set notification profiles, the set user alert group, and the monitor's created time and modified time.
Log Report
The Log Report tab lists all the logs collected during every data collection along with their statuses.
Related links:
How to add an Azure monitor.
How to integrate an Azure App Service monitor.
How to integrate Azure Virtual Machine monitor.
How to configure IT Automations for a monitor.
How to add a Configuration Rule.
