Azure App Service Monitoring Integration
Microsoft Azure enables you to create applications fast. You can easily create enterprise-ready web and mobile apps for any platform or device and deploy them on scalable and reliable cloud infrastructures using Azure App Service.
With Site24x7's integration support with Azure App Service, you can now monitor your hosted applications with accurate metrics, configure thresholds, and get instant alerts when there is a threshold breach.
Setup and configuration
-
Adding Azure App Service while configuring new Azure monitor
If you haven't configured an Azure monitor yet, add one by following the steps below:
-
- Choose Cloud from the left navigation pane, and select Azure > Add Azure Monitor. You can also follow these steps to add an Azure Monitor.
- During Azure monitor configuration, in the Edit Azure Monitor page, select Azure App Service from the Service/Resource Types drop-down.
-
Adding Azure App Service to an existing Azure monitor
If you already have an Azure monitor configured for the tenant, you can add the Azure App Service using the following steps:
-
- Navigate to the Infrastructure Dashboard, Inventory Dashboard, or Management Actions from the left navigation pane of the Azure Monitor for which you wish to add Azure App Service.
- Click this
 icon and then the Edit option, which will bring you to the Edit Azure Monitor page.
 - In the Edit Azure Monitor page, select the corresponding Subscription and the Resource Group from the drop-down menu and select Azure App Service from the Service/Resource Types drop-down and click Save.
After successful configuration, go to Cloud > Azure, select Azure App Service from the the Azure monitor drop-down. Now you can view the discovered App services.
It will take up to 15-30 minutes to discover new Azure resources. For the immediate discovery of the selected configuration, go to the Infrastructure Dashboard of the Azure monitor and click the Discover Now option from this ![]() icon.
icon.
Polling frequency
Site24x7's Azure App Service monitor collects the metric data of every minute and the statuses from your applications in a five minute interval.
Supported metrics
The following metrics are collected:
| Metric name | Description | Statistic | Unit |
|---|---|---|---|
| Connections | The number of bound sockets existing in the sandbox (w3wp.exe and its child processes). A bound socket is created by calling bind()/connect() APIs and remains until said socket is closed with CloseHandle()/closesocket() | Average | Count |
| Memory Working Set | The current amount of memory used by the app | Average | Bytes |
| Average Memory Working Set | The average amount of memory used by the app | Average | Bytes |
| Average Response Time | The average time taken for the app to serve requests | Average | Seconds |
| Response Time | The time taken for the app to serve the requests | Average | Seconds |
| Data In | The amount of incoming bandwidth consumed by the app | Average | Bytes |
| Data Out | The amount of outgoing bandwidth consumed by the app | Average | Bytes |
| CPU Time | The amount of CPU consumed by the app | Average | Seconds |
| Current Assemblies | The current number of assemblies loaded across all AppDomains in the application | Average | Count |
| Gen 0 Garbage Collections | The number of times the generation 0 objects are garbage collected since the start of the app process. Higher generation garbage collections (GCs) include all lower generation GCs | Average | Count |
| Gen 1 Garbage Collections | The number of times the Gen 1 objects are garbage collected since the start of the app process. Higher generation GCs include all lower generation GCs | Average | Count |
| Gen 2 Garbage Collections | The number of times the Gen 2 objects are garbage collected since the start of the app process | Average | Count |
| Handle Count | The total number of handles currently opened by the app process | Average | Count |
| Http 101 | The total number of requests resulting in an HTTP 101 status code | Total | Count |
| Http 401 | The total number of requests resulting in an HTTP 401 status code | Total | Count |
| Http 403 | The total number of requests resulting in an HTTP 403 status code | Total | Count |
| Http 404 | The total number of requests resulting in an HTTP 404 status code | Total | Count |
| Http 406 | The total number of requests resulting in an HTTP 406 status code | Total | Count |
| Thread Count | The number of threads currently active in the app process | Total | Count |
| Http 2xx | The count of requests resulting in an HTTP status code greater than or equal to 200 but less than 300 | Average | Count |
| Http 3xx | The count of requests resulting in an HTTP status code greater than or equal to 300 but less than 400 | Average | Count |
| Http 4xx | The count of requests resulting in an HTTP status code greater than or equal to 400 but less than 500 | Average | Count |
| Http Server Errors | The count of requests resulting in an HTTP status code greater than or equal to 500 but less than 600 | Average | Count |
| IO Other Bytes per Second | The rate at which the app process is issuing bytes to input or output (I/O) operations that don't involve data, such as control operations | Average | Bytes per second |
| IO Other Operations per Second | The rate at which the app process is issuing I/O operations that aren't read or write operations | Average | Bytes per second |
| IO Read Bytes per Second | The rate at which the app process is reading bytes from I/O operations | Average | Bytes per second |
| IO Read Operations per Second | The rate at which the app process is issuing read I/O operations | Average | Bytes per second |
| IO Write Bytes per Second | The rate at which the app process is writing bytes to I/O operations | Average | Bytes per second |
| IO Write Operations per Second | The rate at which the app process is issuing write I/O operations | Average | Bytes per second |
| Requests | The total number of requests regardless of their resulting HTTP status code | Total | Count |
| Private Bytes | The current size of memory that the app process has allocated that can't be shared with other processes | Average | Bytes |
| Requests in Application Queue | The average number of requests in the application request queue | Average | Count |
| Health Check Status | The health check data of the app | Average | Count |
| File System Usage | The amount of file system consumed by the app | Average | Bytes |
Azure Uptime monitoring
Site24x7’s Azure Uptime monitoring enables proactive tracking of your Azure resources’ availability and uptime, along with their configuration and inventory details. Note that uptime monitoring will disable performance metric data collection.
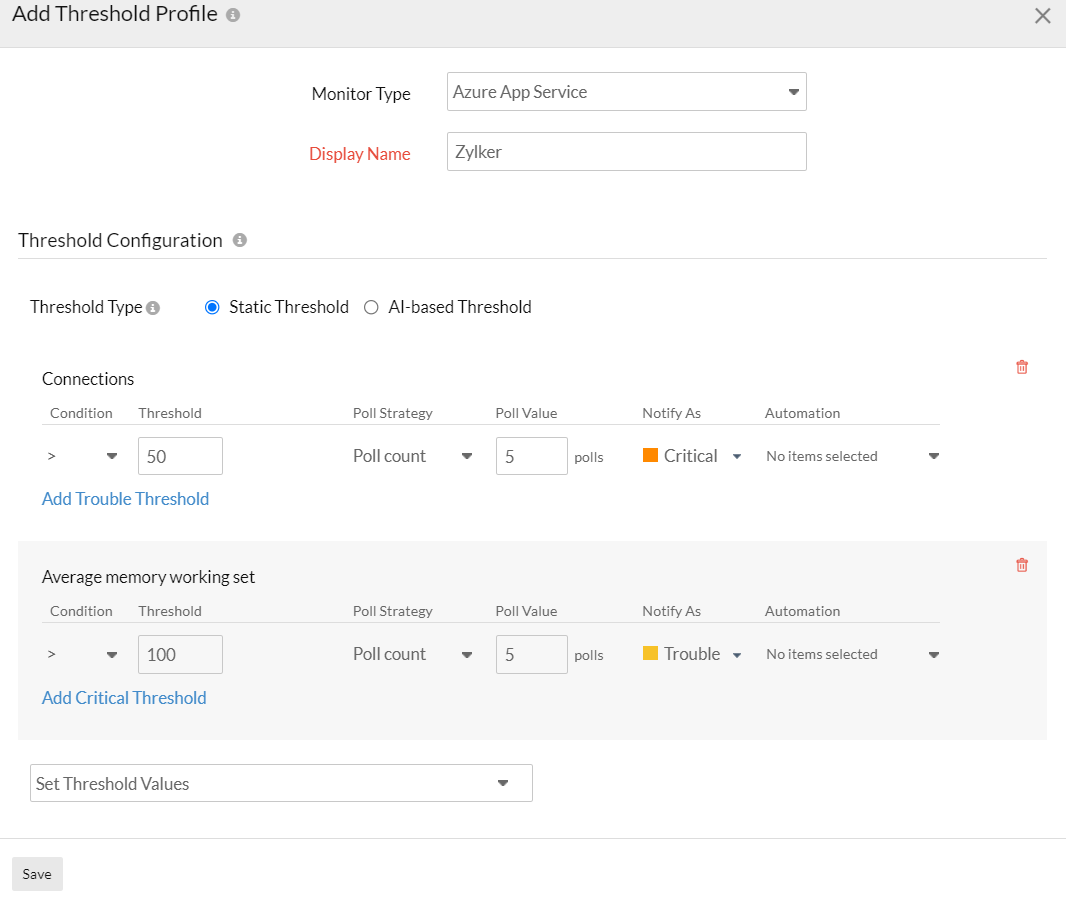
Threshold configuration
- Global configuration
-
- Go to the Admin section on the left navigation pane.
- Select Configuration Profiles from the left pane and choose the Threshold and Availability (+) tab from the drop-down menu.
- Choose the monitor type as Azure App Service.
You can set the threshold values for all the metrics mentioned above.
- Monitor-level configuration
-
- Go to Cloud > Azure and select Azure App Service from the drop-down menu.
- Choose a resource for which you would like to set a threshold and then click this
 icon on the top. Choose the Edit option, which directs you to the Edit Azure App Service Monitor page.
 - You can set the threshold values for the metrics by selecting the Threshold and Availability option. You can also configure IT automation at the attribute level.
IT automation
Site24x7 offers a set of exclusive IT automation tools to auto-resolve performance degradation issues. These react to an event or incident proactively rather than waiting for manual intervention. These tools help automate repetitive tasks and automatically remediate threshold breaches.
How to configure IT automations for a monitor
Configuration Rules
Editing multiple monitors to configure Threshold profile, Notification profile, Tags, Monitor groups and other settings can be a tedious process. With the Configuration Rules, you can automate the configuration settings of your monitoring resources. While adding new monitors, you can run a check, and associate any of the previously created rules that match the monitor configurations.
How to add a configuration rule
Summary
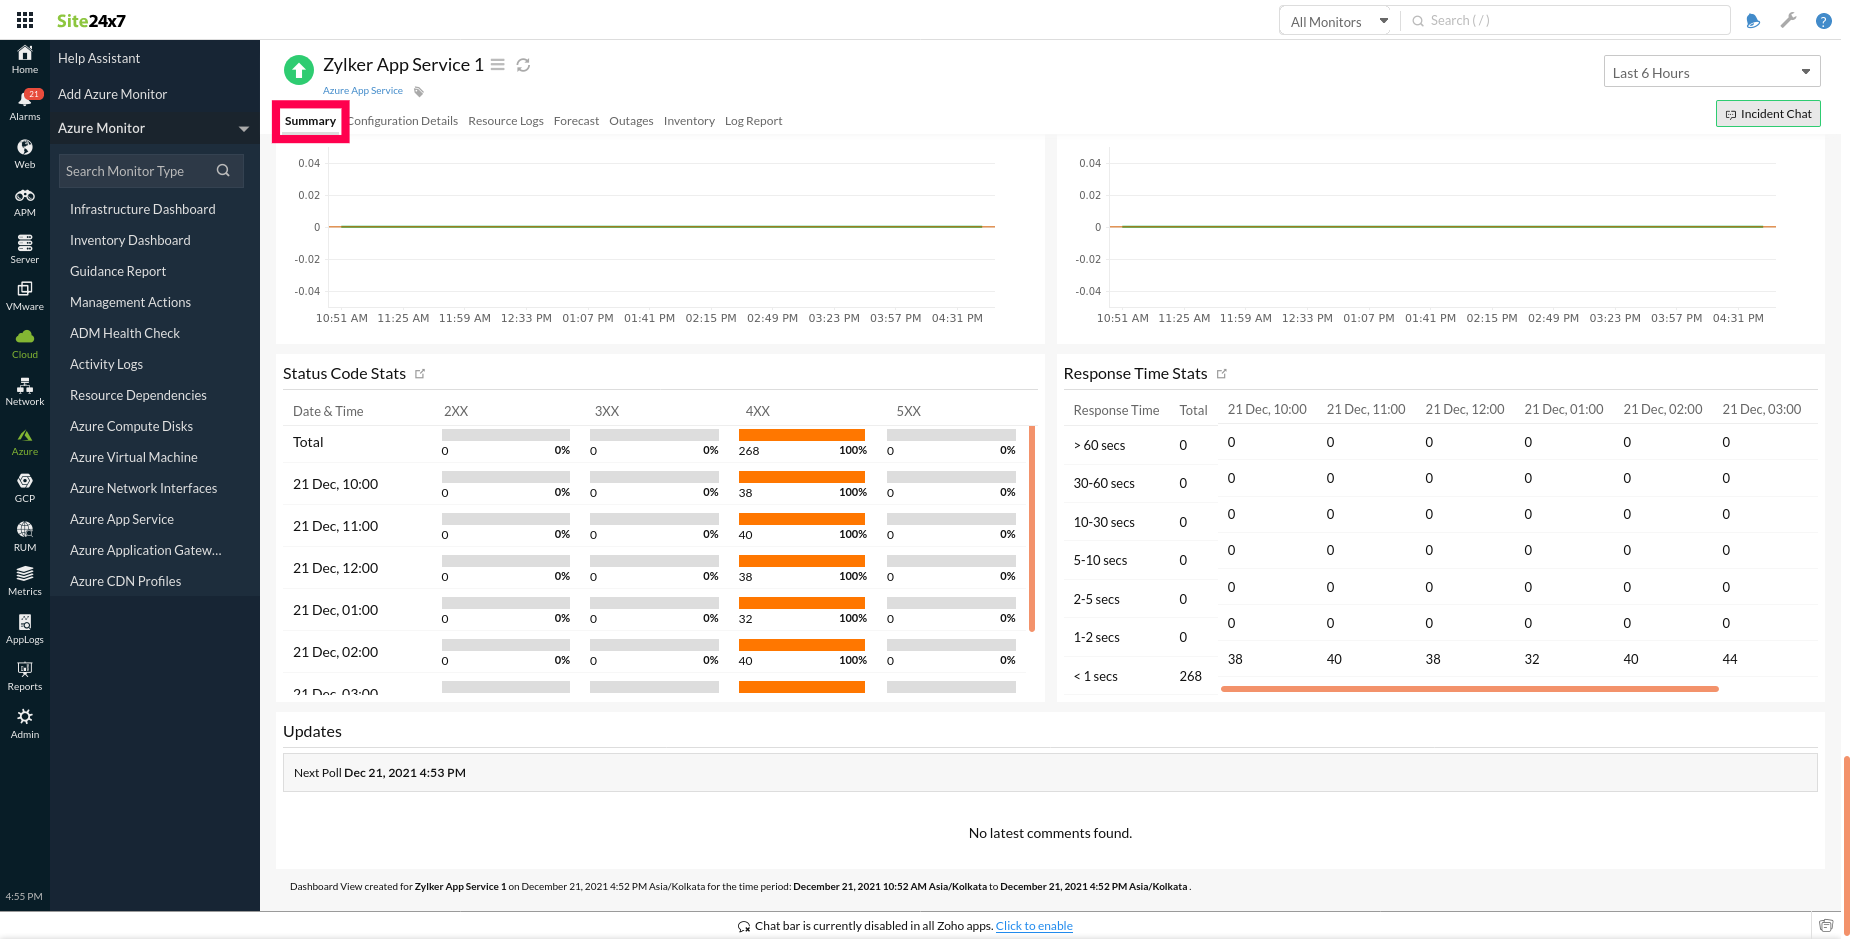
The summary tab will show the performance data organized by time for the above-mentioned metrics.
- To view the summary, go to Cloud > Azure, click the Azure monitor > Azure App Service.
- Click a resource and select the Summary tab.
If the Resource Log option is enabled, you can also view the stats of the HTTP status code and the response time analysis.
Configuration Details
The Configuration Details tab provides details of an application instance. Here, you will find the enabled Host Names, Site Properties, SSL Certificates, Server Farm Details, and so on.
- To get the configuration details, go to Cloud > Azure and click the Azure monitor > Azure App Service.
- Click a resource and select the Configuration Details tab.
Resource Logs
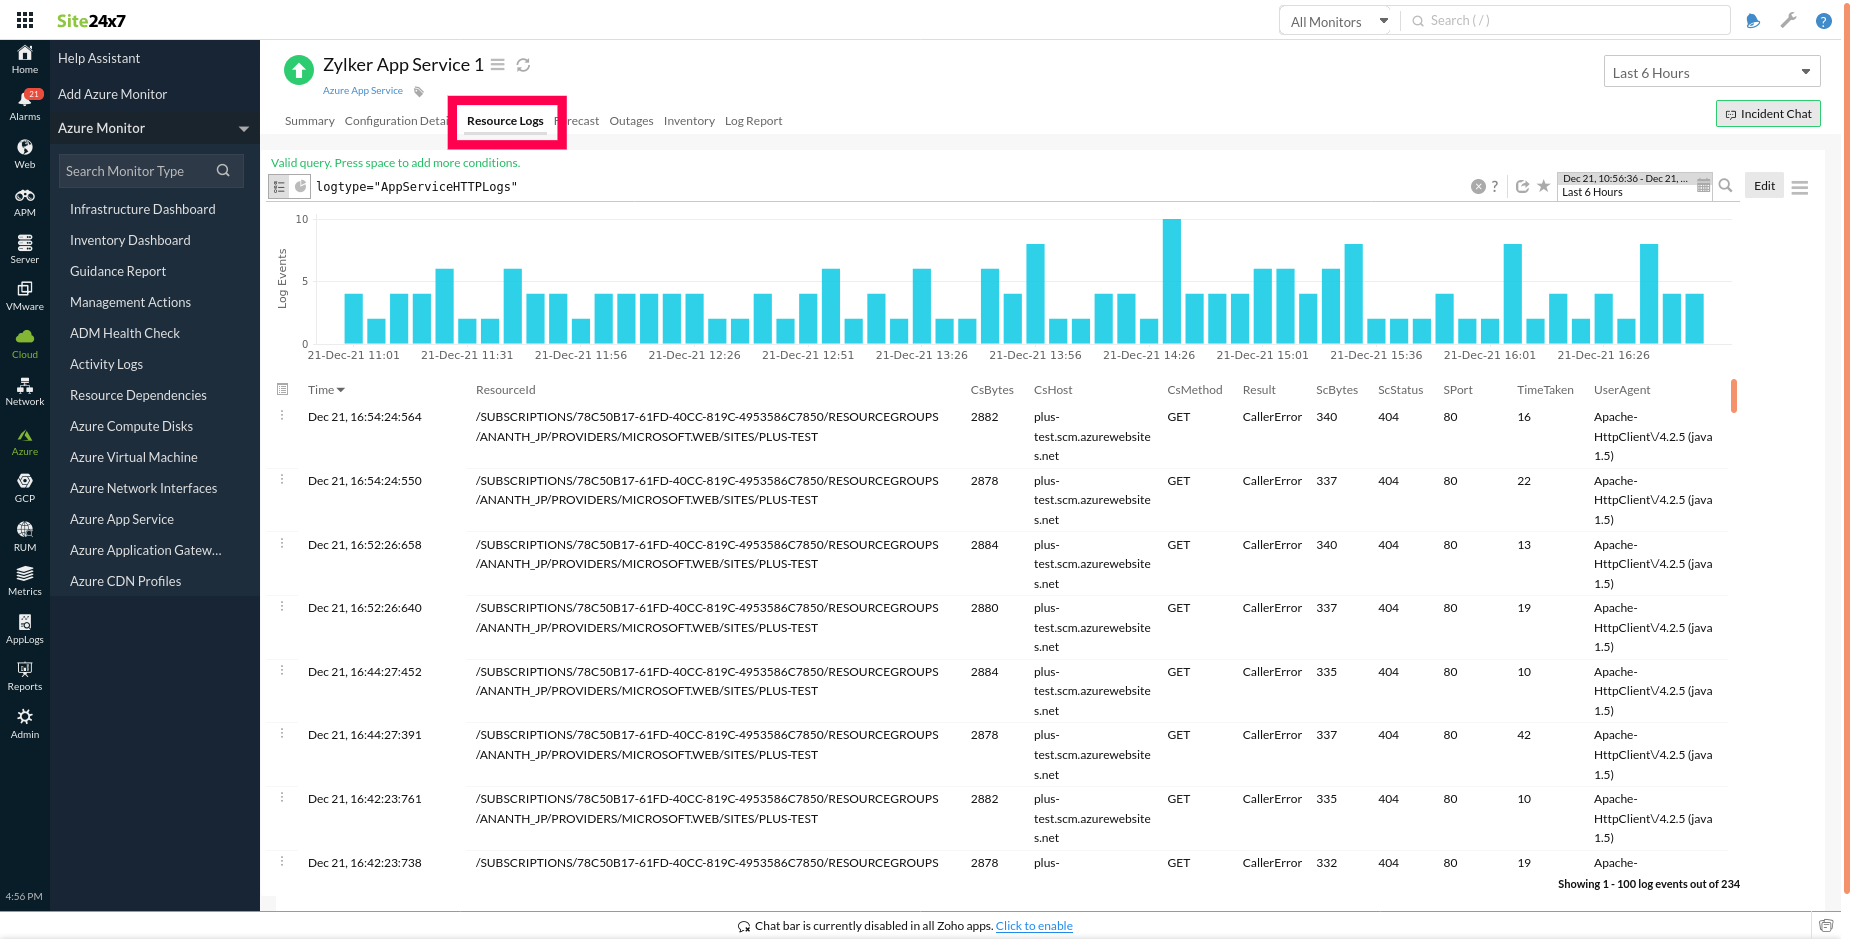
Monitor all the operations performed within the Azure App Service resources with the resource logs. To enable resource logs, follow the steps in the document.
You can view the Resource Logs by navigating to Cloud > Azure > Azure App Service, click a resource, and then select the Resource Logs tab.
Forecast
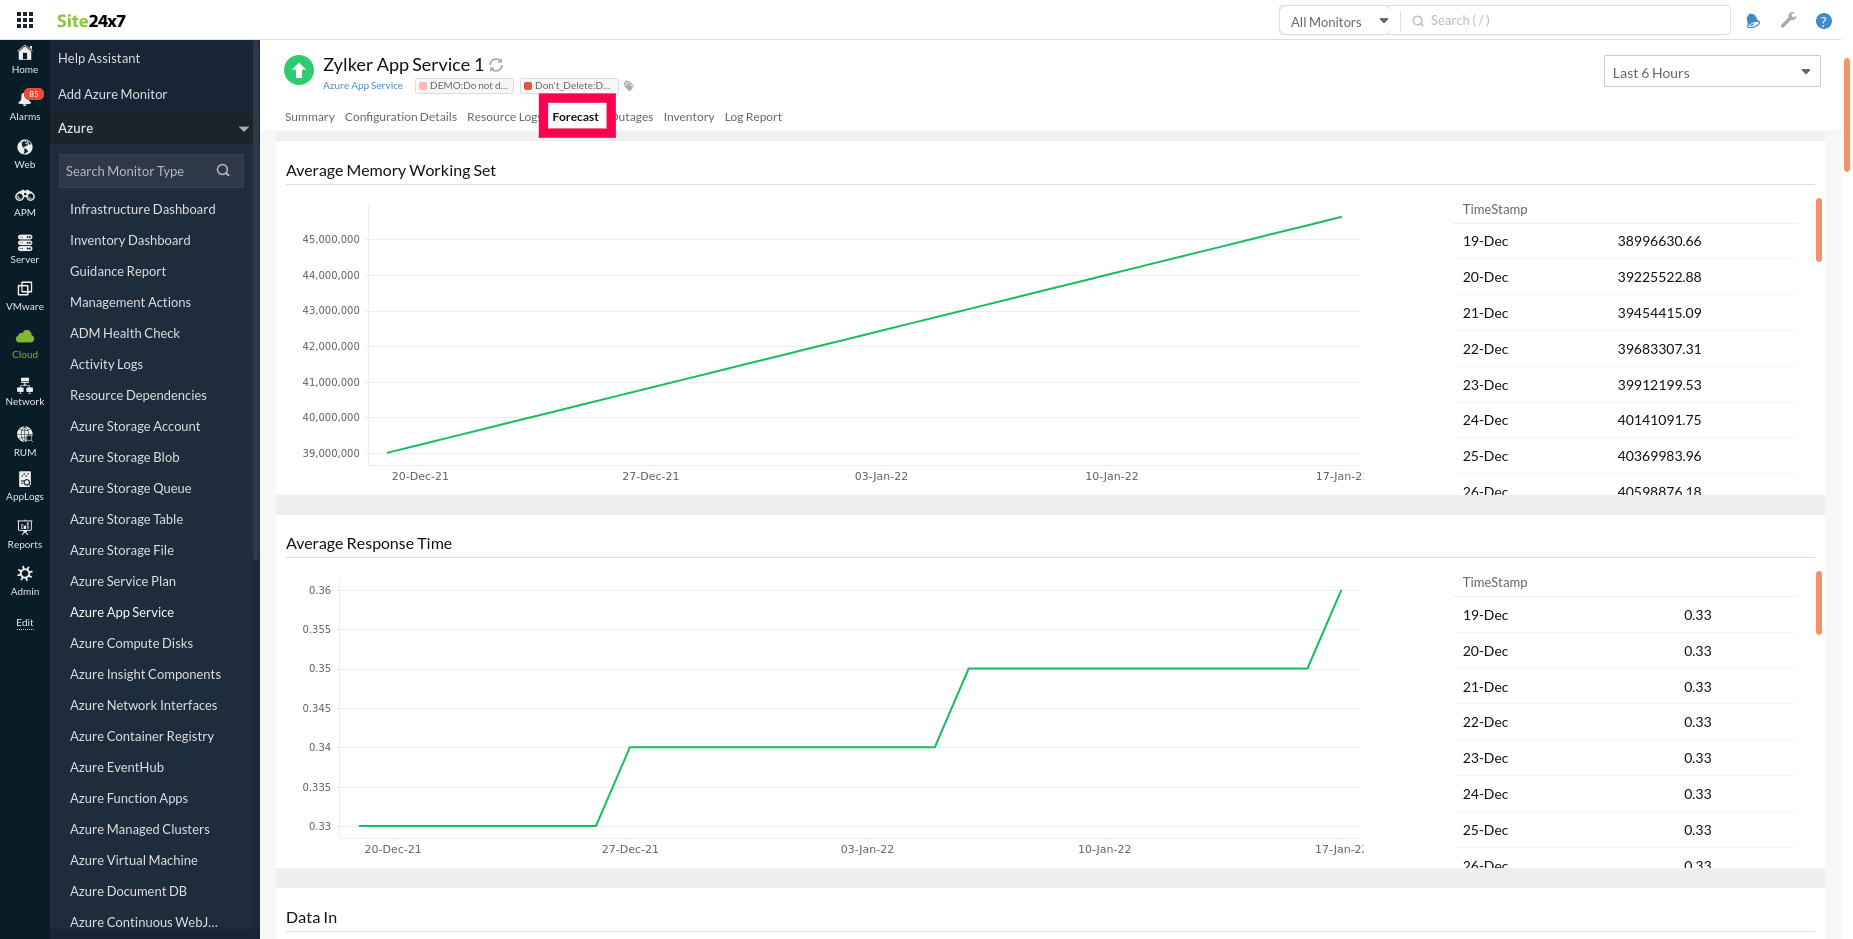
The Forecasting Engine of Site24x7 enables you to predict the future points of Azure App Service performance metrics based on historical observations. To predict your metric value for the next seven days, it takes about fifteen to thirty days of historical data to observe.
- You can view the forecast charts by navigating to the Cloud section in the left navigation pane.
- Select Azure App Service from the Azure drop-down, click a resource, and then choose the Forecast tab.
Reports
Gain in-depth data about the various parameters of your monitored resources and accentuate your service performance using our insightful reports.
To view reports for Azure App Service:
- Navigate to the Reports section on the left navigation pane.
- Select Azure App Service from the menu on the left.
You can find the Availability Summary Report and the Performance Report for the selected monitor. You can also get the Inventory Report, Summary Report, Availability Summary Report, Health Trend Report, and the Performance Report for all the Azure App Service monitors.
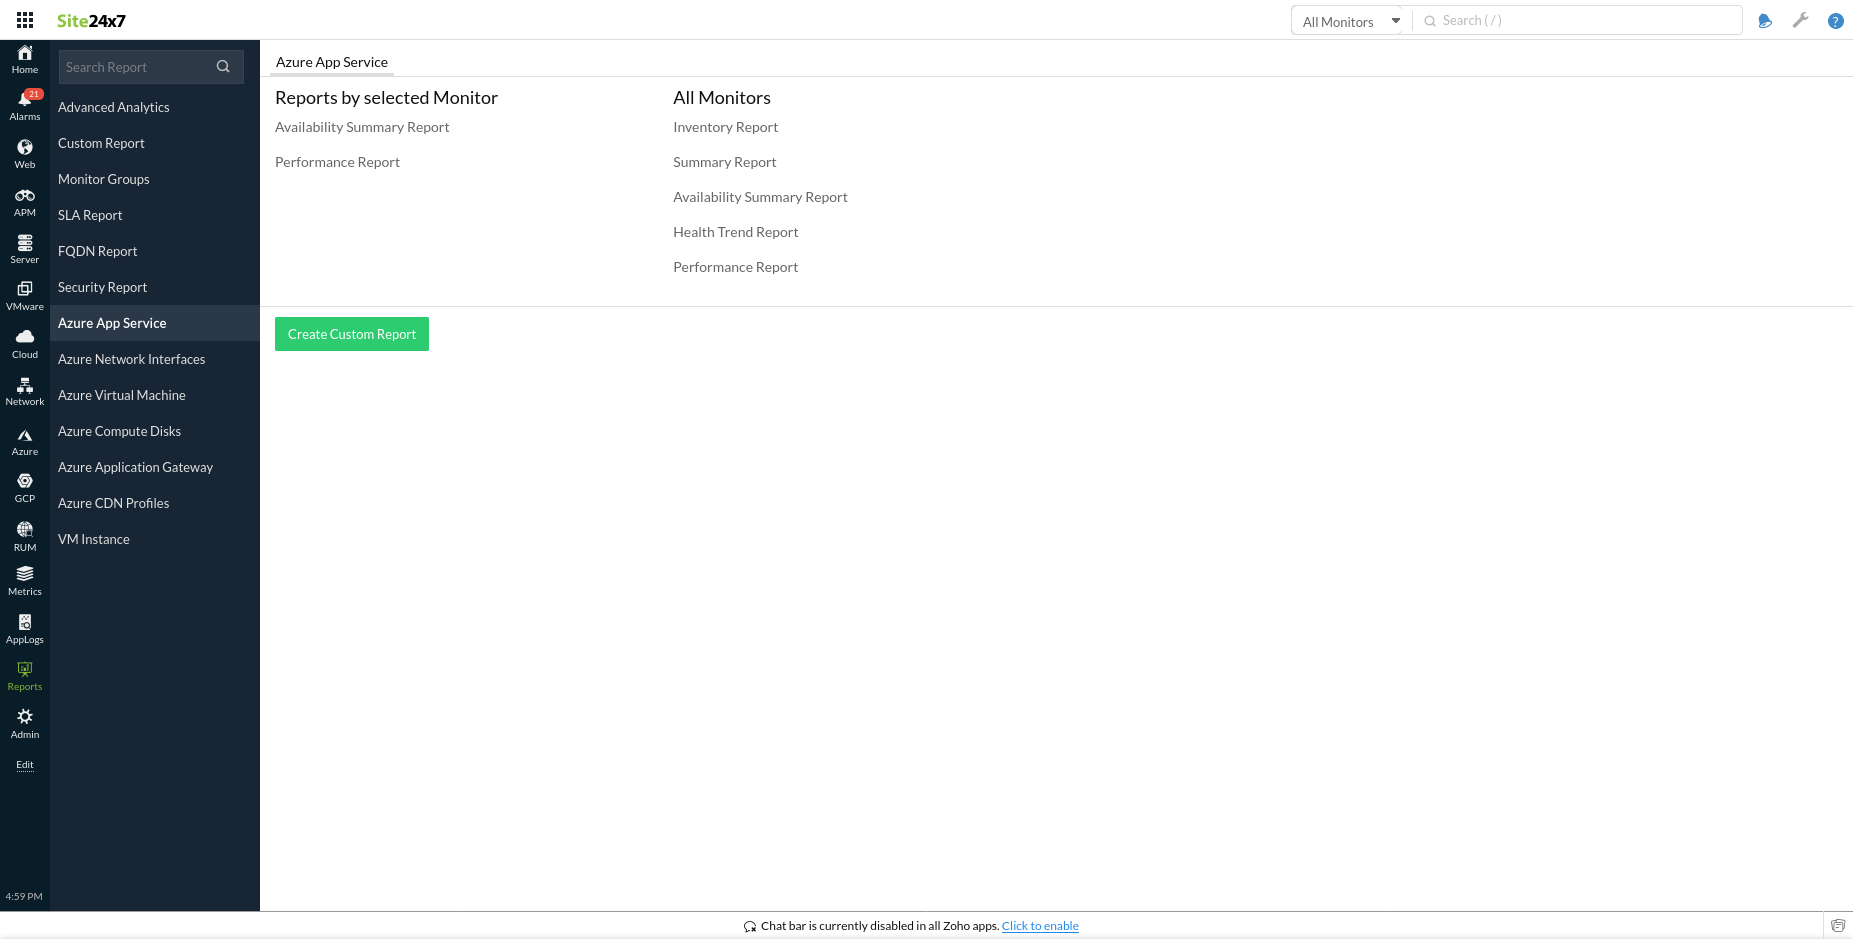
You can also get reports from the Summary tab of the App Service Monitor.
- Go to the Summary tab of a resource, and get the Availability Summary Report of the monitor by clicking on Availability or Downtime. Similarly, you can view the Performance Report of the monitor by clicking on any chart title.
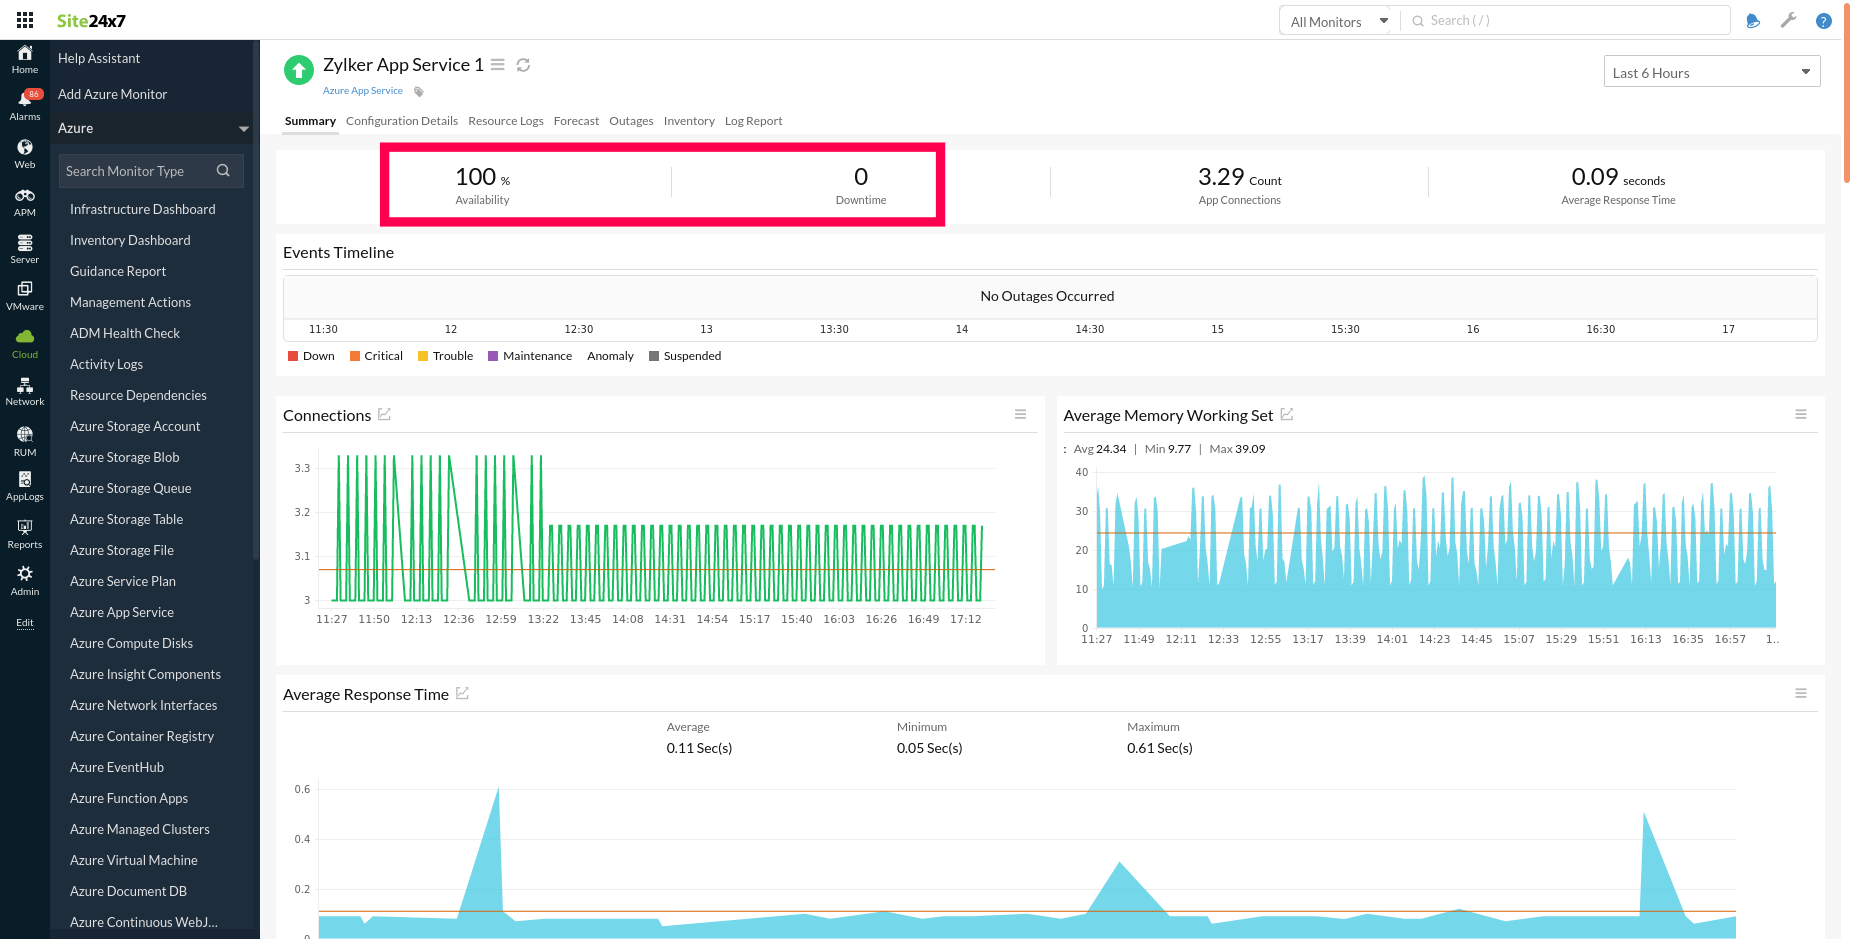
Check out the list of reports offered by Site24x7 for your individual monitor types.
Site24x7's App Service monitoring interface
Get an overview of the availability and usage status of your App Service.
Summary
The Summary tab will help you view metrics such as CPU Time and Requests, Http 3xx, Http 2xx and Http 401, Data In and Data Out, and more.
Zia Forecast
By leveraging the AI-driven Zia framework, you can examine resource consumption measurements through the forecast chart located in the Zia Forecast tab. This chart predicts upcoming performance metrics based on a seven-day historical data analysis, providing insights into the expected metric usage for the next seven days.
Configuration Details
The Configuration Details tab provides the configuration details of your App service. Details on the availability state, Custom Domain Verification Id, Linux Fx Version, and more are included in this section.
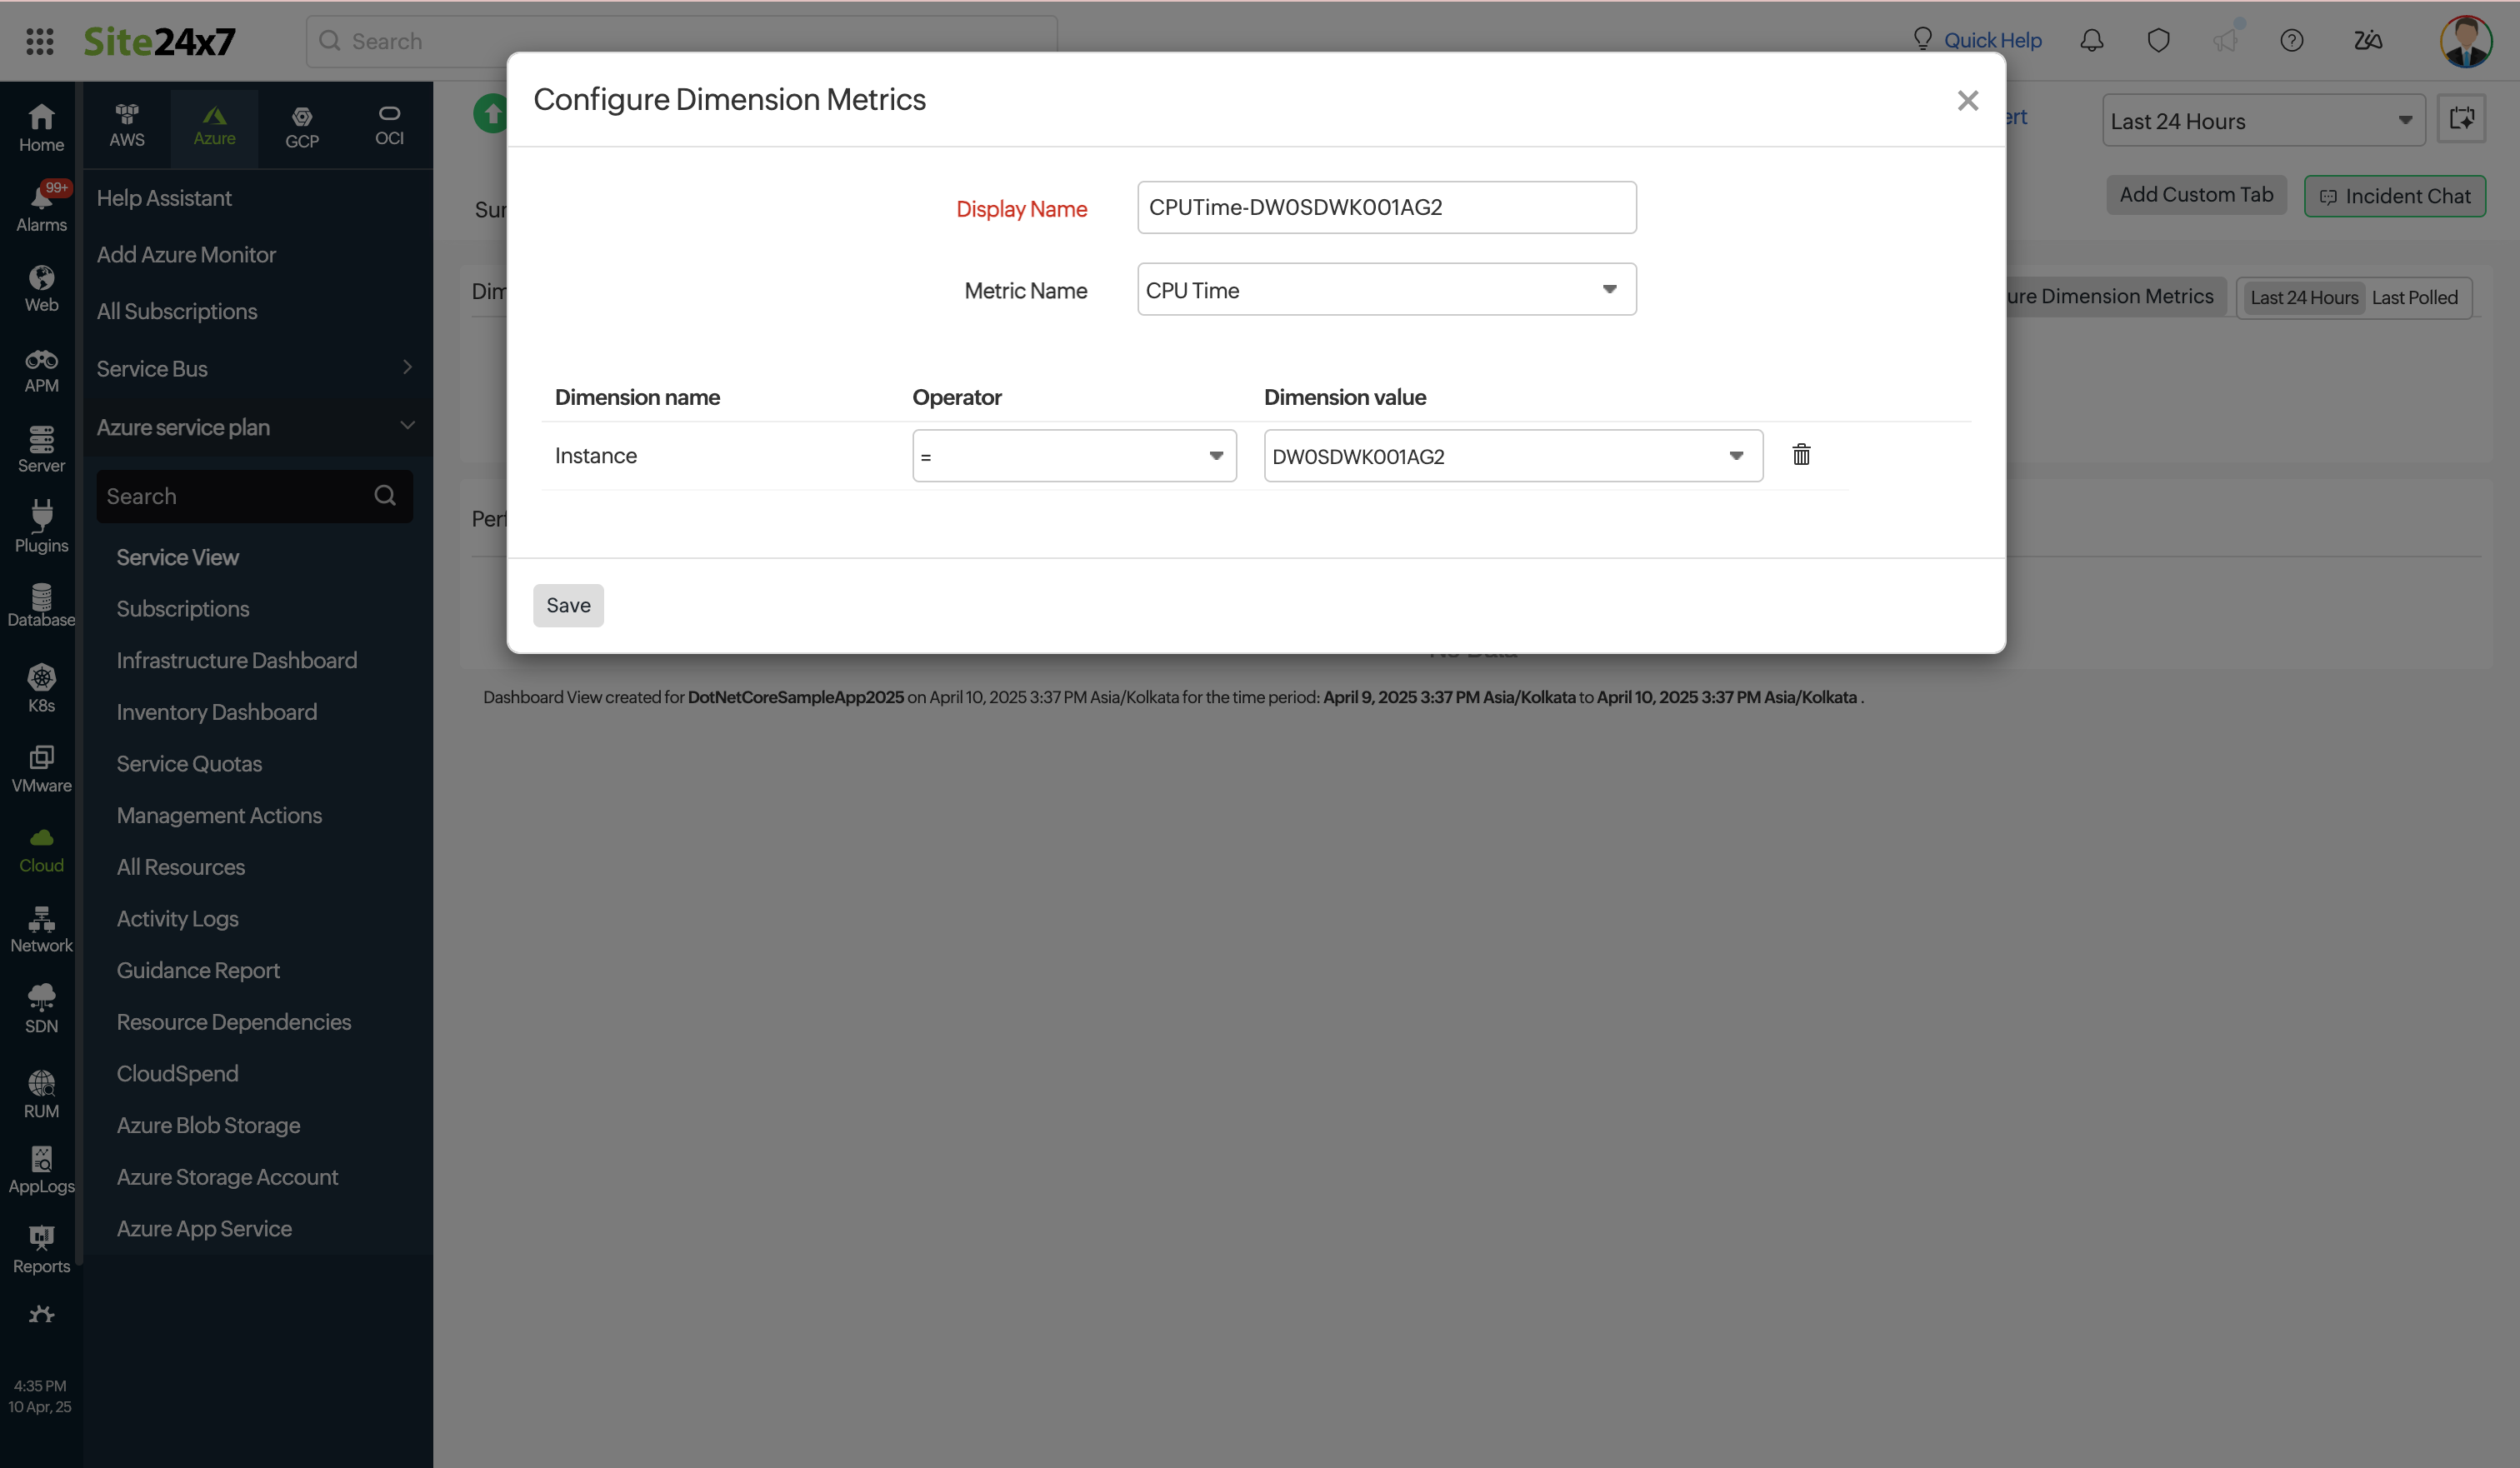
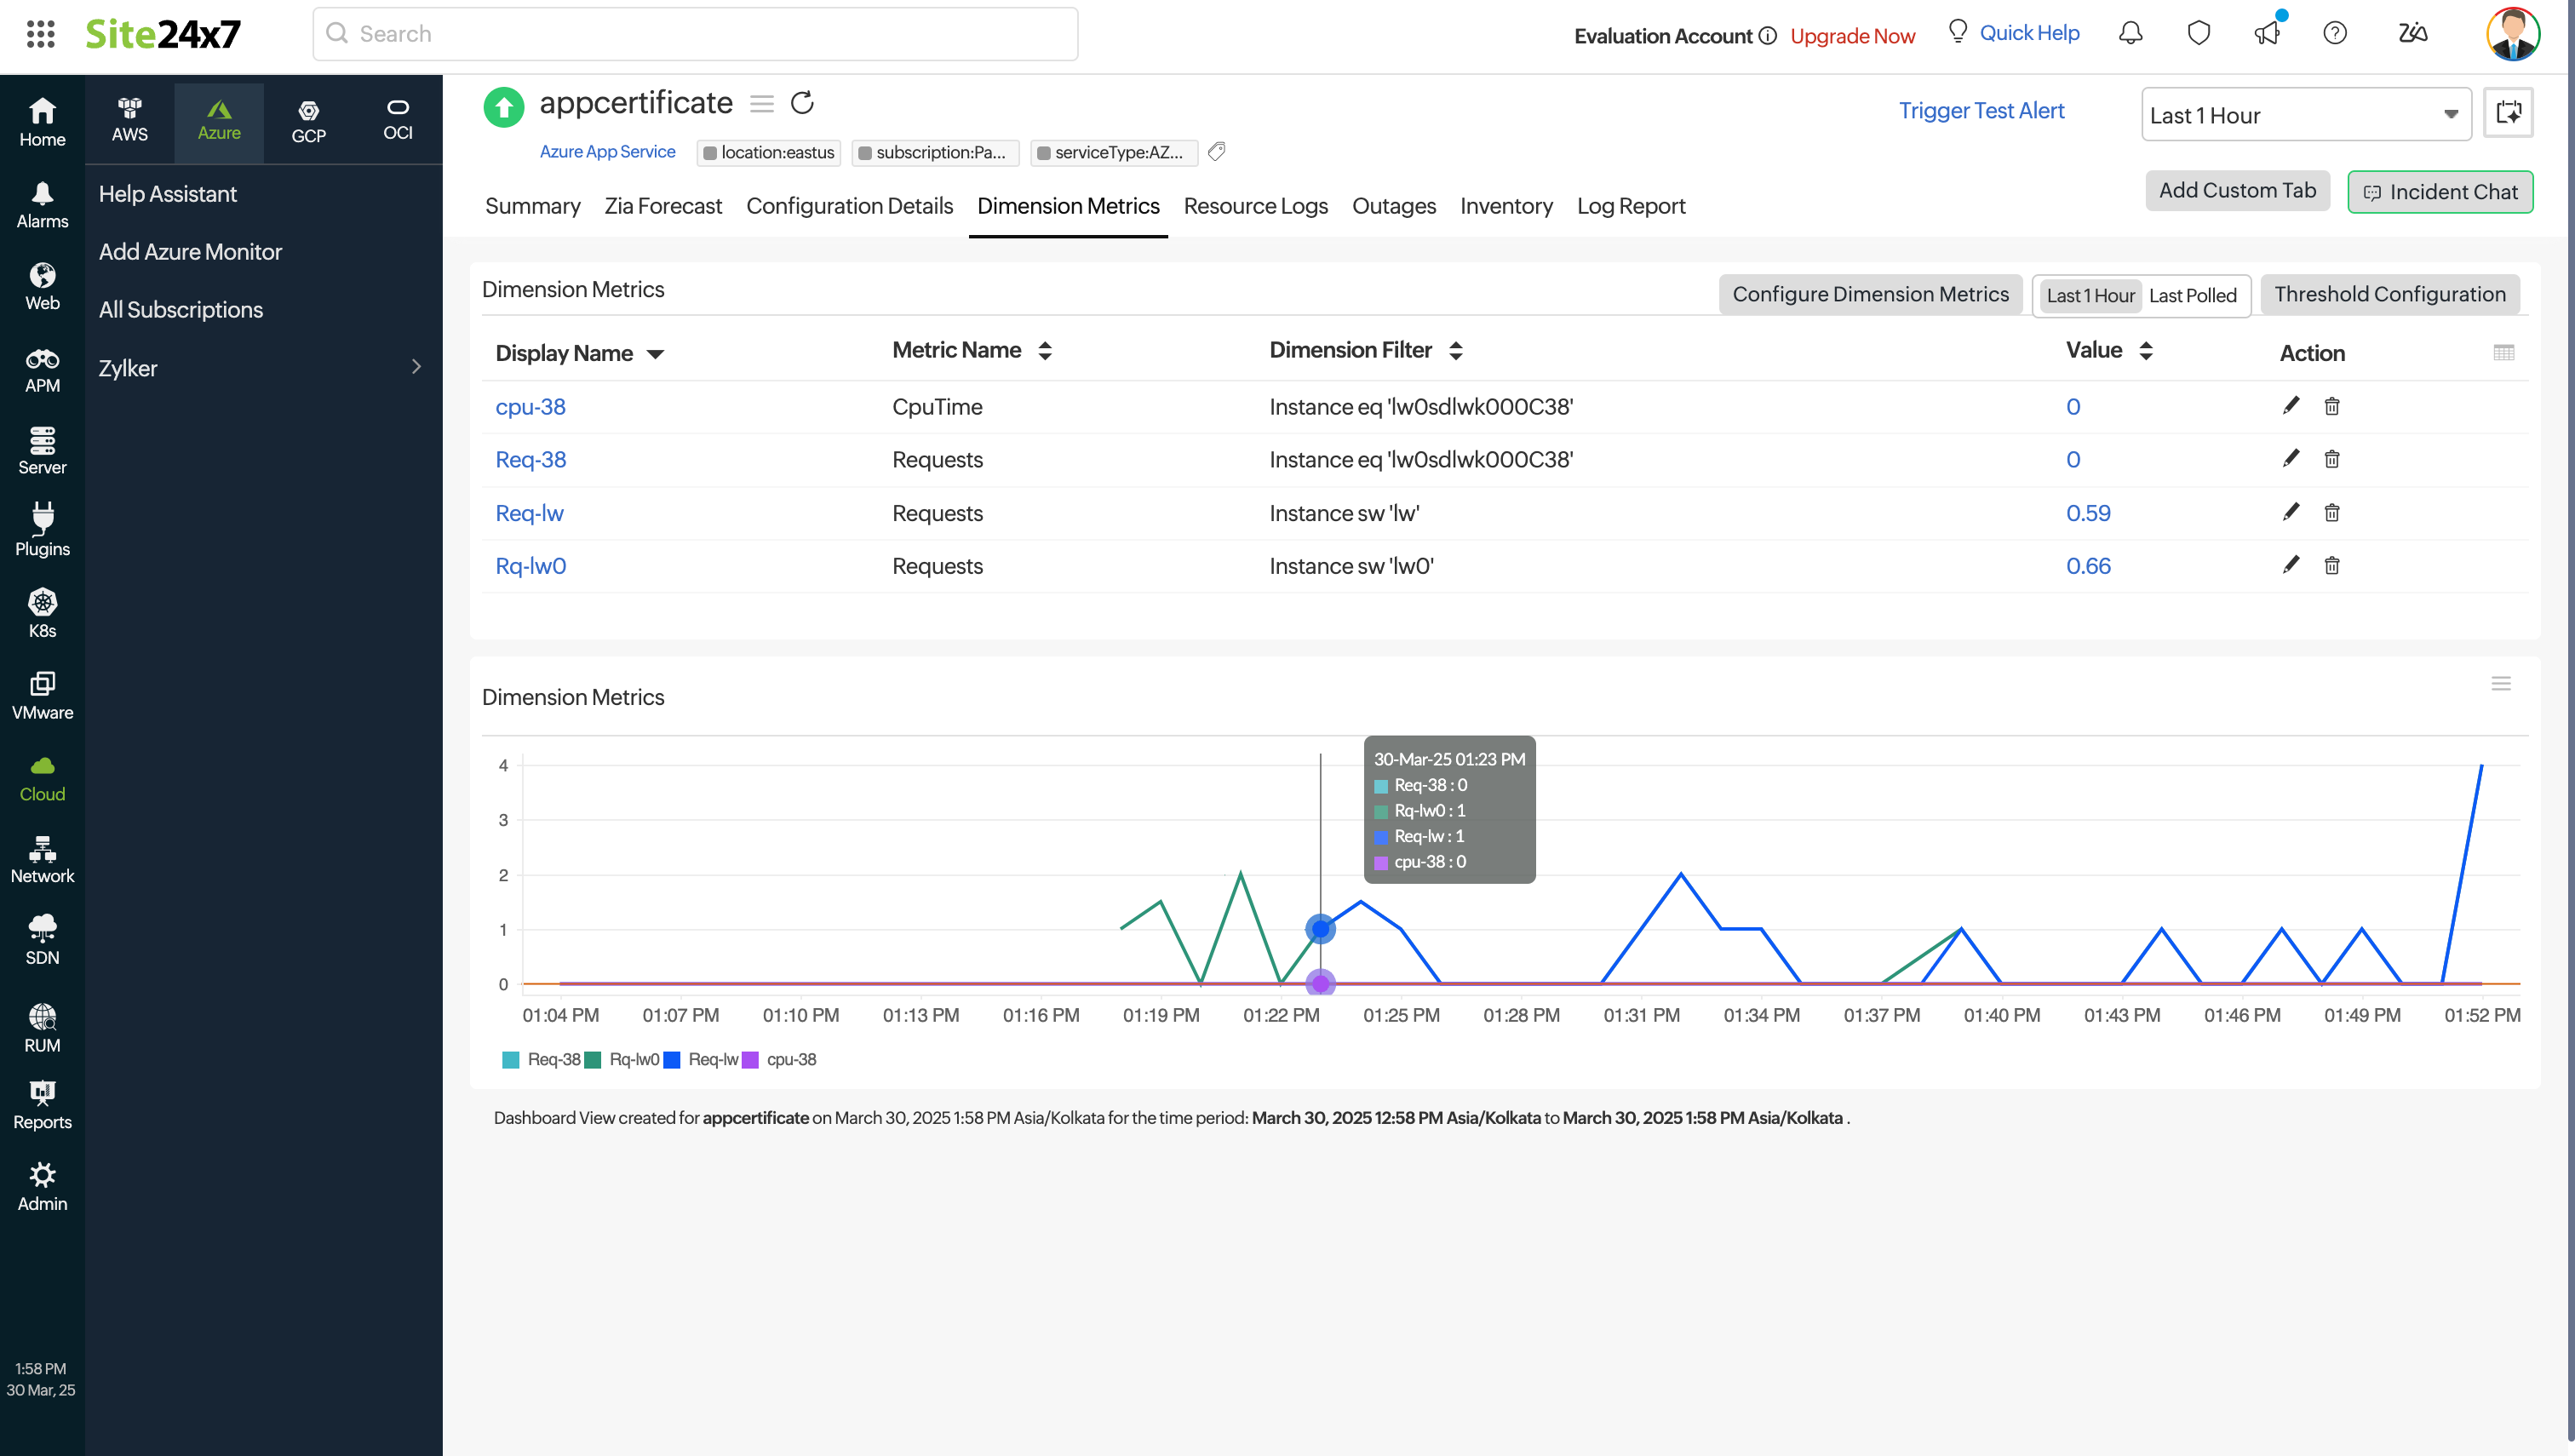
Dimension Metrics
Configure Dimension Metrics to view the dimension metric information. Get alerts by applying the respective dimension filter and configuring thresholds for them. You can apply thresholds in bulk for the metrics. Edit and delete the monitored dimension metrics using the Action option. You can also fetch the various dimensions for a preferred metric by providing the Dimension value while configuring the dimension metric. You can monitor up to 25 dimension metrics.
Resource Logs
View all your diagnostic/resource logs in one place, gain powerful insights, and receive alerts from your log data.
Outages
The Outages tab provides the history of the App Service statuses, including Down, Trouble, and Critical.
Inventory
The Inventory tab provides licensing details, threshold and availability profiles, notification profiles, the assigned user alert group, and the monitor's creation and modification times.
Log Report
The Log Report tab lists all the logs collected during every data collection along with their statuses.
Related links:
How to add an Azure monitor.
How to integrate Azure Virtual Machine monitor.
How to integrate Azure Network Interface monitor.
How to configure IT automations for a monitor.
How are Resource Logs collected from Azure.
