Azure Cosmos DB for NoSQL monitoring integration
Azure Cosmos DB for NoSQL is a non-relational service that natively stores JSON documents with flexible schema.
With Site24x7's integration, you can monitor your database with accurate metrics, configure thresholds, and get instant alerts if there is a breach.
Table of contents
- Setup and configuration
- Polling frequency
- Supported metrics
- Threshold configuration
- IT automation
- Configuration rules
- Reports
- Site24x7's Cosmos DB for NoSQL monitoring interface
Setup and configuration
Adding an Azure Cosmos DB for NoSQL while configuring a new Azure monitor
If you haven't configured an Azure Monitor yet, add one by following the steps below:
- Log in to your Site24x7 account.
- Choose Cloud from the left navigation pane, and select Azure > Add Azure Monitor. You can also follow these steps to add an Azure Monitor.
- During Azure monitor configuration, in the Add Azure Monitor page, select Azure Cosmos DB for NoSQL along with other required resource types from the Service/Resource Types drop-down. Check if you have configured the corresponding Resource groups and Tag filters in the Edit page.
Adding an Azure Cosmos DB for NoSQL to an existing Azure monitor
If you already have an Azure monitor configured for the tenant, you can add the Azure Cosmos DB for NoSQL using the following steps:
- Log in to your Site24x7 account.
- Navigate to Cloud > Azure > select the Azure monitor from the left pane for which you wish to add an Azure Cosmos DB for NoSQL.
- In the Service View page, click the Enable Monitoring button in the Azure Cosmos DB for NoSQL Service type. Check if you have configured the corresponding Resource groups and Tag filters in the Edit page.

It will take 15-30 minutes to discover new Azure resources. To immediately discover the selected configuration, click Discover Now in the top-right corner, by doing which all the resources that match the filters configured in Azure Edit page will be discovered even if the Auto-Discover New Resources option is disabled.
Now, you can view the discovered databases from the Service View dashboard itself.
Polling frequency
Site24x7's Azure Cosmos DB for NoSQL monitor collects metric data every minute and the statuses from your applications every five minutes.
Supported metrics
Usage
| Metric | Description | Statistic | Unit |
| Service Availability | The percentage of availability requests made by the account at one hour, day, or month granularity. | Average | Percent |
| Metadata Requests | The number of metadata requests. Cosmos DB maintains a system metadata collection for each account, which allows users to enumerate collections, databases, etc., and their configurations, free of charge. | Count | Count |
| Data Usage | The total data usage reported at five minutes granularity. | Average | Bytes |
| Index Usage | The total index usage reported at five minutes granularity. | Average | Bytes |
| Document Count | The total document count reported at five minutes, one hour, and one day granularity. | Average | Count |
| Document Quota | The total storage quota reported at five minutes granularity. | Average | Bytes |
| Account Created | The number of accounts created. | Count | Count |
| Account Deleted | The number of accounts deleted. | Count | Count |
| Total Requests | The total number of requests made. | Count | Count |
| Total Request Units | The number of SQL request units consumed. | Average | Count |
| Normalized RU Consumption | The percentage of maximum RU consumed per minute. | Average | Percent |
| Autoscaled RU | The number of autoscaled RU consumed per region and per partition autoscale. | Maximum | Count |
| Account Keys Updated | The number of updated account keys. | Count | Count |
| Account Network Settings Updated | The number of updated account network settings. | Count | Count |
| Autoscale Max Throughput | The number of throughputs that autoscale in the particular database. | Maximum | Count |
| Provisioned Throughput | The number of provisioned throughputs. | Maximum | Count |
| Account Replication Settings Updated | The number of updated account replication settings. | Count | Count |
| Account Diagnostic Settings Updated | The number of updated account diagnostic settings. | Count | Count |
| Materialized View Catchup Gap In Minutes | Maximum time difference in minutes between data in the source container and data propagated to the materialized view. | Maximum | Count |
| Materialized Views Builder Average CPU Usage | Average CPU usage across materialized view builder instances, which are used for populating data in materialized views. | Average | Percent |
| Materialized Views Builder Average Memory Usage | Average memory usage across materialized view builder instances, which are used for populating data in materialized views. | Average | Bytes |
| Materialized Views Builder Maximum CPU Usage | Average maximum CPU usage across materialized view builder instances, which are used for populating data in materialized views. | Average | Percent |
Resilience
| Metric | Description | Statistic | Unit |
| Server Side Latency | The amount of latency recorded on the server side. | Average | Milliseconds |
| Server Side Latency Direct | The amount of latency recorded in the server side on direct connection mode. | Average | Milliseconds |
| Server Side Latency Gateway | The amount of latency recorded on the server side in gateway connection mode. | Average | Milliseconds |
| Physical Partition Count | The number of physical partitions. | Maximum | Count |
| Physical Partition Size | The size of physical partition. | Average | Bytes |
| Physical Partition Throughput | The number of physical partition throughputs. | Maximum | Count |
| Region Added | The number of regions added. | Count | Count |
| Region Removed | The number of regions removed. | Count | Count |
| Region Offlined | The number of regions made offline. | Count | Count |
| Region Onlined | The number of regions made online. | Count | Count |
| Region Failed Over | The number of regions that failed over. | Count | Count |
| P99 Replication Latency | The amount of P99 replication latency across source and target regions for geo-enabled account. | Average | Milliseconds |
Dedicated Gateway
| Metric | Description | Statistic | Unit |
| Dedicated Gateway Average CPU Usage | The average amount of CPU usage across dedicated gateway instances. | Average | Percent |
| Dedicated Gateway Average Memory Usage | The average memory usage across dedicated gateway instances, which is used for both routing requests and caching data. | Average | Bytes |
| Dedicated Gateway CPU Usage | The amount of CPU usage across dedicated gateway instances. | Average | Percent |
| Dedicated Gateway Maximum CPU Usage | The average maximum CPU usage across dedicated gateway instances. | Average | Percent |
| Dedicated Gateway Memory Usage | The average memory usage across dedicated gateway instances. | Average | Bytes |
| Dedicated Gateway Requests | The number of requests at the dedicated gateway. | Count | Count |
| Integrated Cache Evicted Entries Size | The average size of the entries evicted from the integrated cache. | Average | Bytes |
| Integrated Cache Item Expiration Count | The number of items evicted from the integrated cache due to time to live (TTL) expiration. | Average | Count |
| Integrated Cache Item Hit Rate | The percentage of the number of point reads that used the integrated cache divided by number of point reads routed through the dedicated gateway with eventual consistency. | Average | Percent |
| Integrated Cache Query Expiration Count | The number of queries evicted from the integrated cache due to TTL expiration. | Average | Count |
| Integrated Cache Query Hit Rate | The percentage of the number of queries that used the integrated cache divided by number of queries routed through the dedicated gateway with eventual consistency. | Average | Percent |
Threshold configuration
Associating a threshold profile can be done from the monitor Edit page:
- Under Configuration Profiles > Threshold and Availability > select the corresponding threshold profile from the drop-down.

 pencil icon respectively.
Bulk Action:
Bulk association of threshold profiles can be done from Admin page (Admin > Inventory > Bulk Action > Under Monitor Configuration, go to Modify Threshold Profile).
You can set the threshold values for the metrics by selecting the Threshold and Availability option. You can also configure IT automation at the attribute level.
Default thresholds
Site24x7 alerts you based on a set of default thresholds. These default thresholds ensure that your database capacity is not overutilized, thus maintaining optimal storage and performance. This also helps in reducing costs. The default thresholds are provided for the below metrics:
- Public Network Access Changed
- Default Consistency Policy Changed
- Service Availability
- Normalized RU Consumption
- Account Keys Updated
- Region Removed
- SQL Container Created
- SQL Container Updated
- SQL Container Deleted
- SQL Database Created
- SQL Database Updated
- SQL Database Deleted
IT automation
Site24x7 offers a set of exclusive IT automation tools to auto-resolve performance degradation issues. These tools react to events proactively rather than waiting for manual intervention.
How to configure IT Automation for a monitor.
Configuration Rules
With Site24x7's Configuration Rules, you can set parameters like Threshold Profile, Notification Profile, Tags, and Monitor Group for multiple monitors. These rules can be configured and run for the existing or new monitors (during addition) matching the given criteria.
How to add a configuration rule.
Reports
Gain in-depth data about the various parameters of your monitored resources and accentuate your service performance using our insightful reports.
To view reports for an Azure Cosmos DB for NoSQL:
- Navigate to the Reports section on the left navigation pane.
- Select Azure Cosmos DB for NoSQL from the menu on the left.
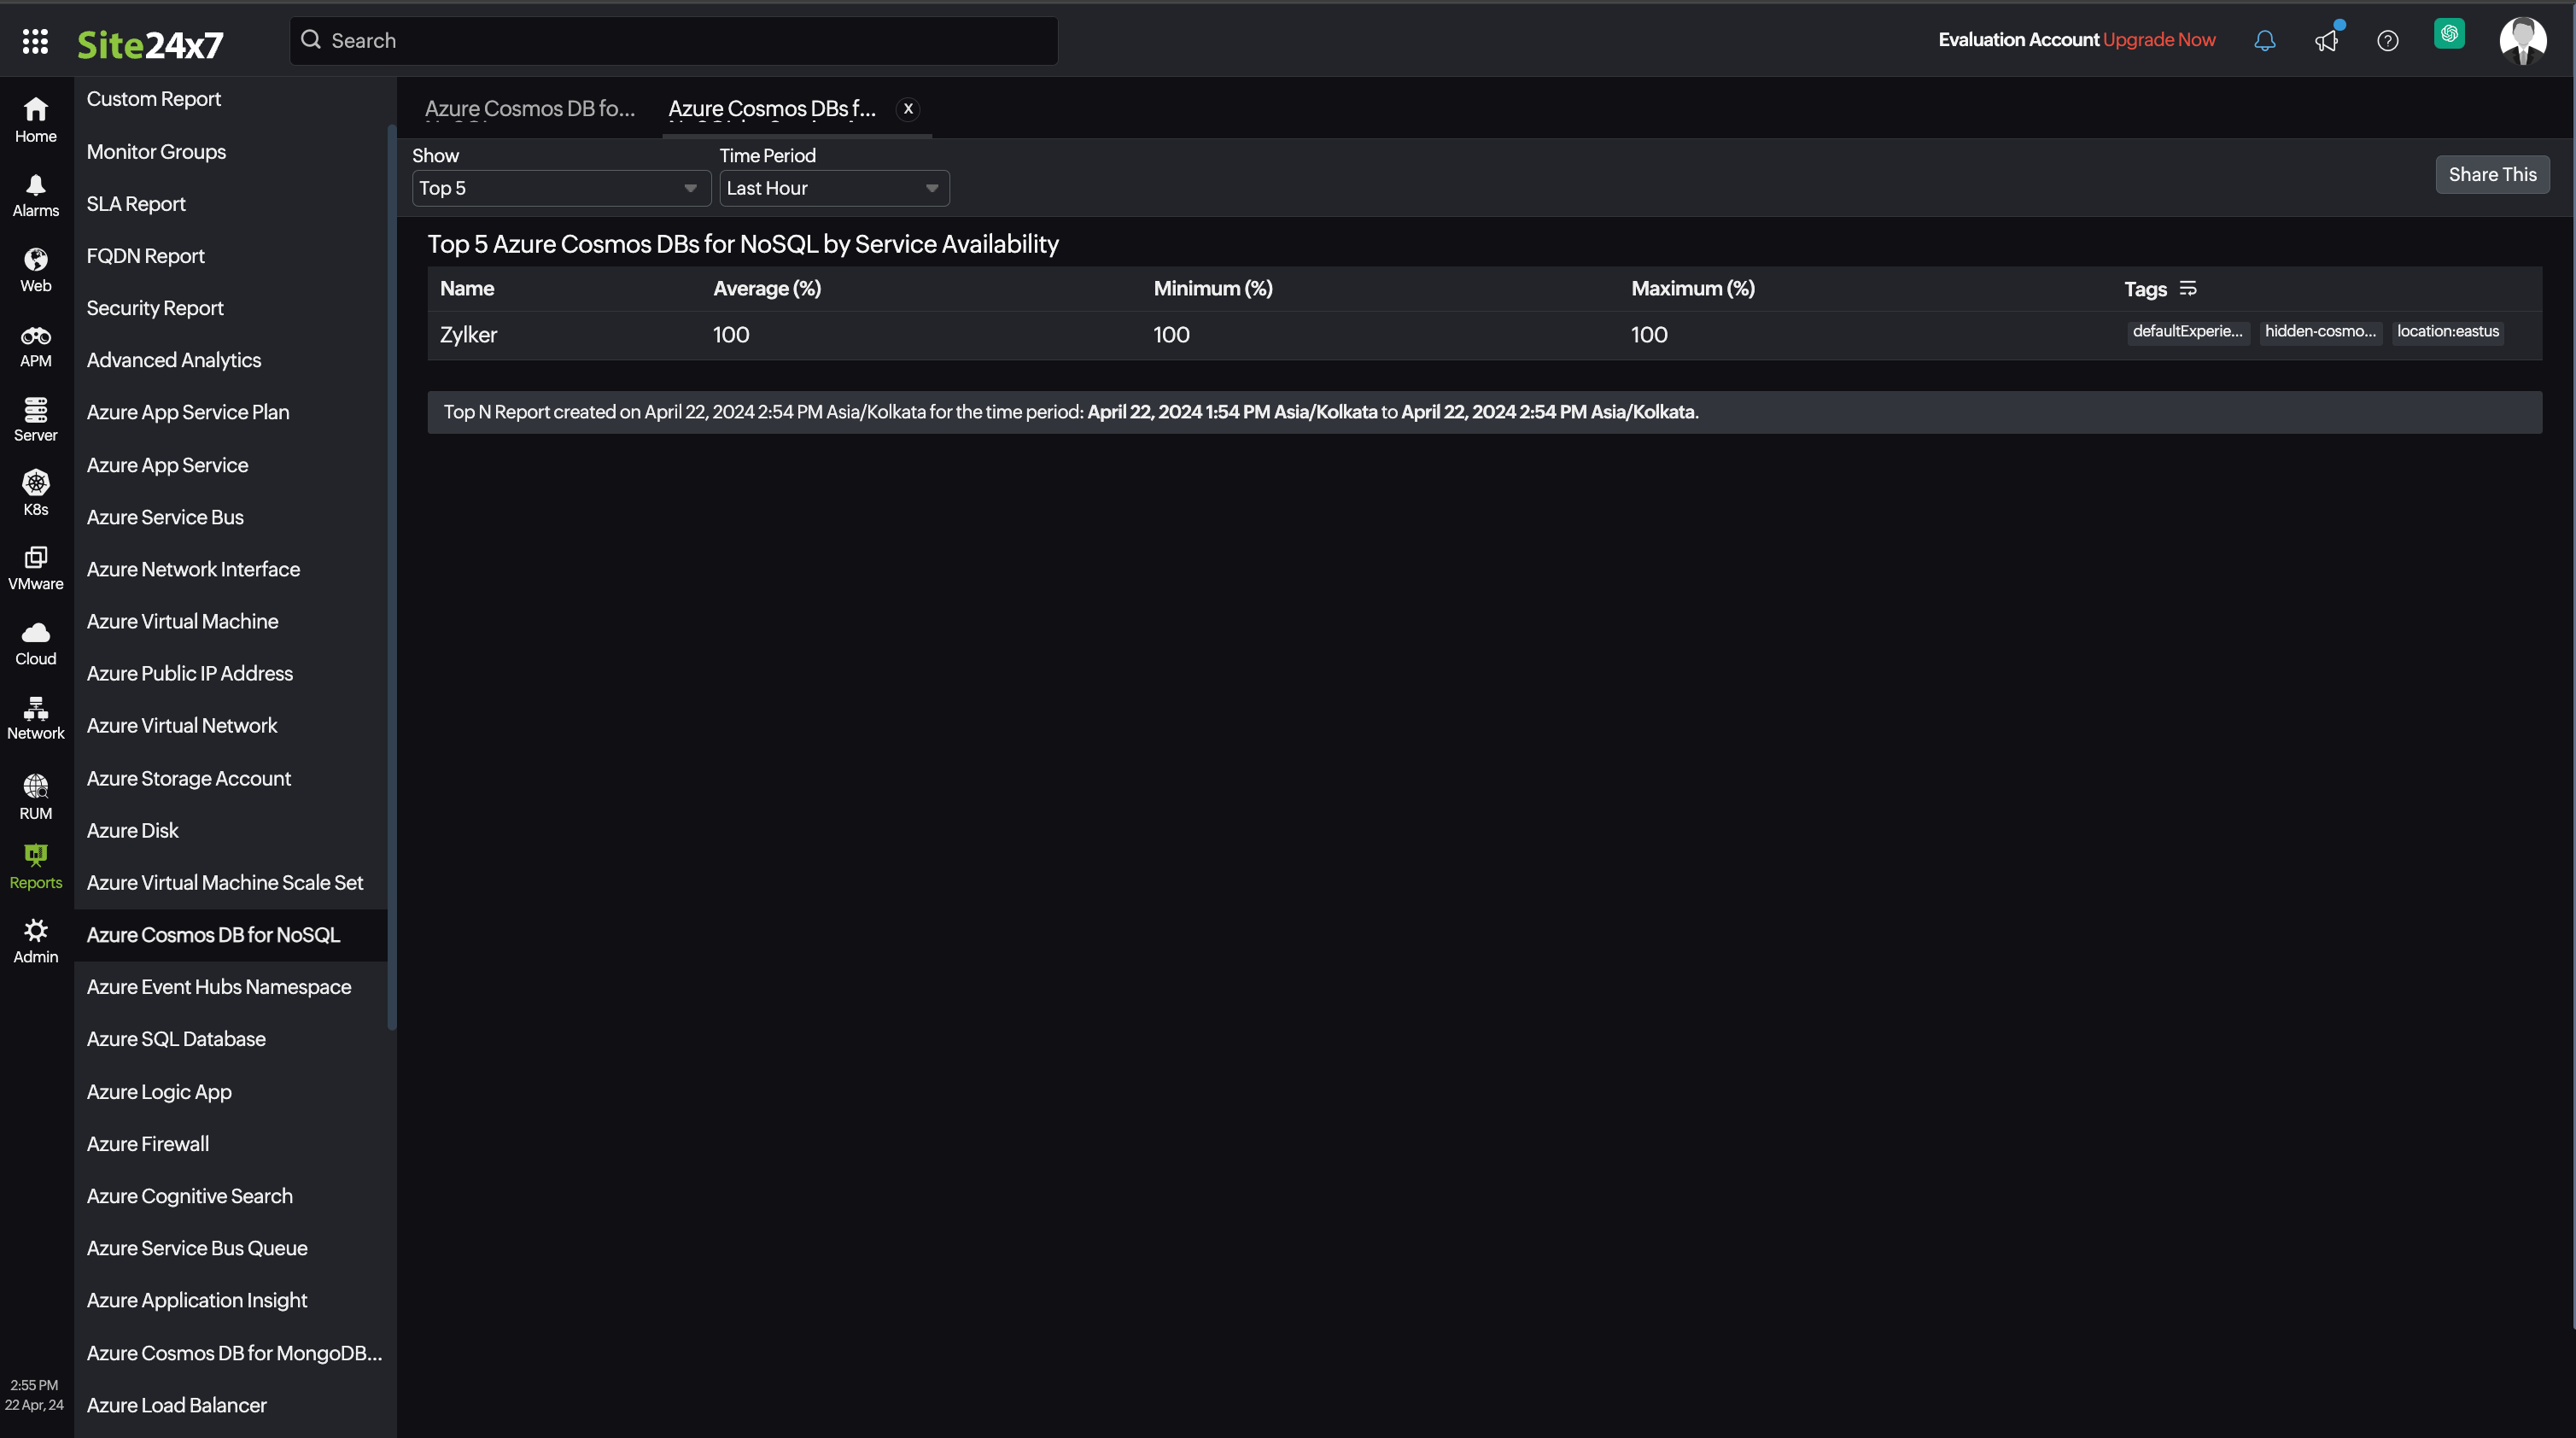
You can find the Availability Summary Report, and Performance Report for one selected monitor, or you can get the Inventory Report, Summary Report, Availability Summary Report, Health Trend Report, and Performance Report for all the monitors.
Schedule reports
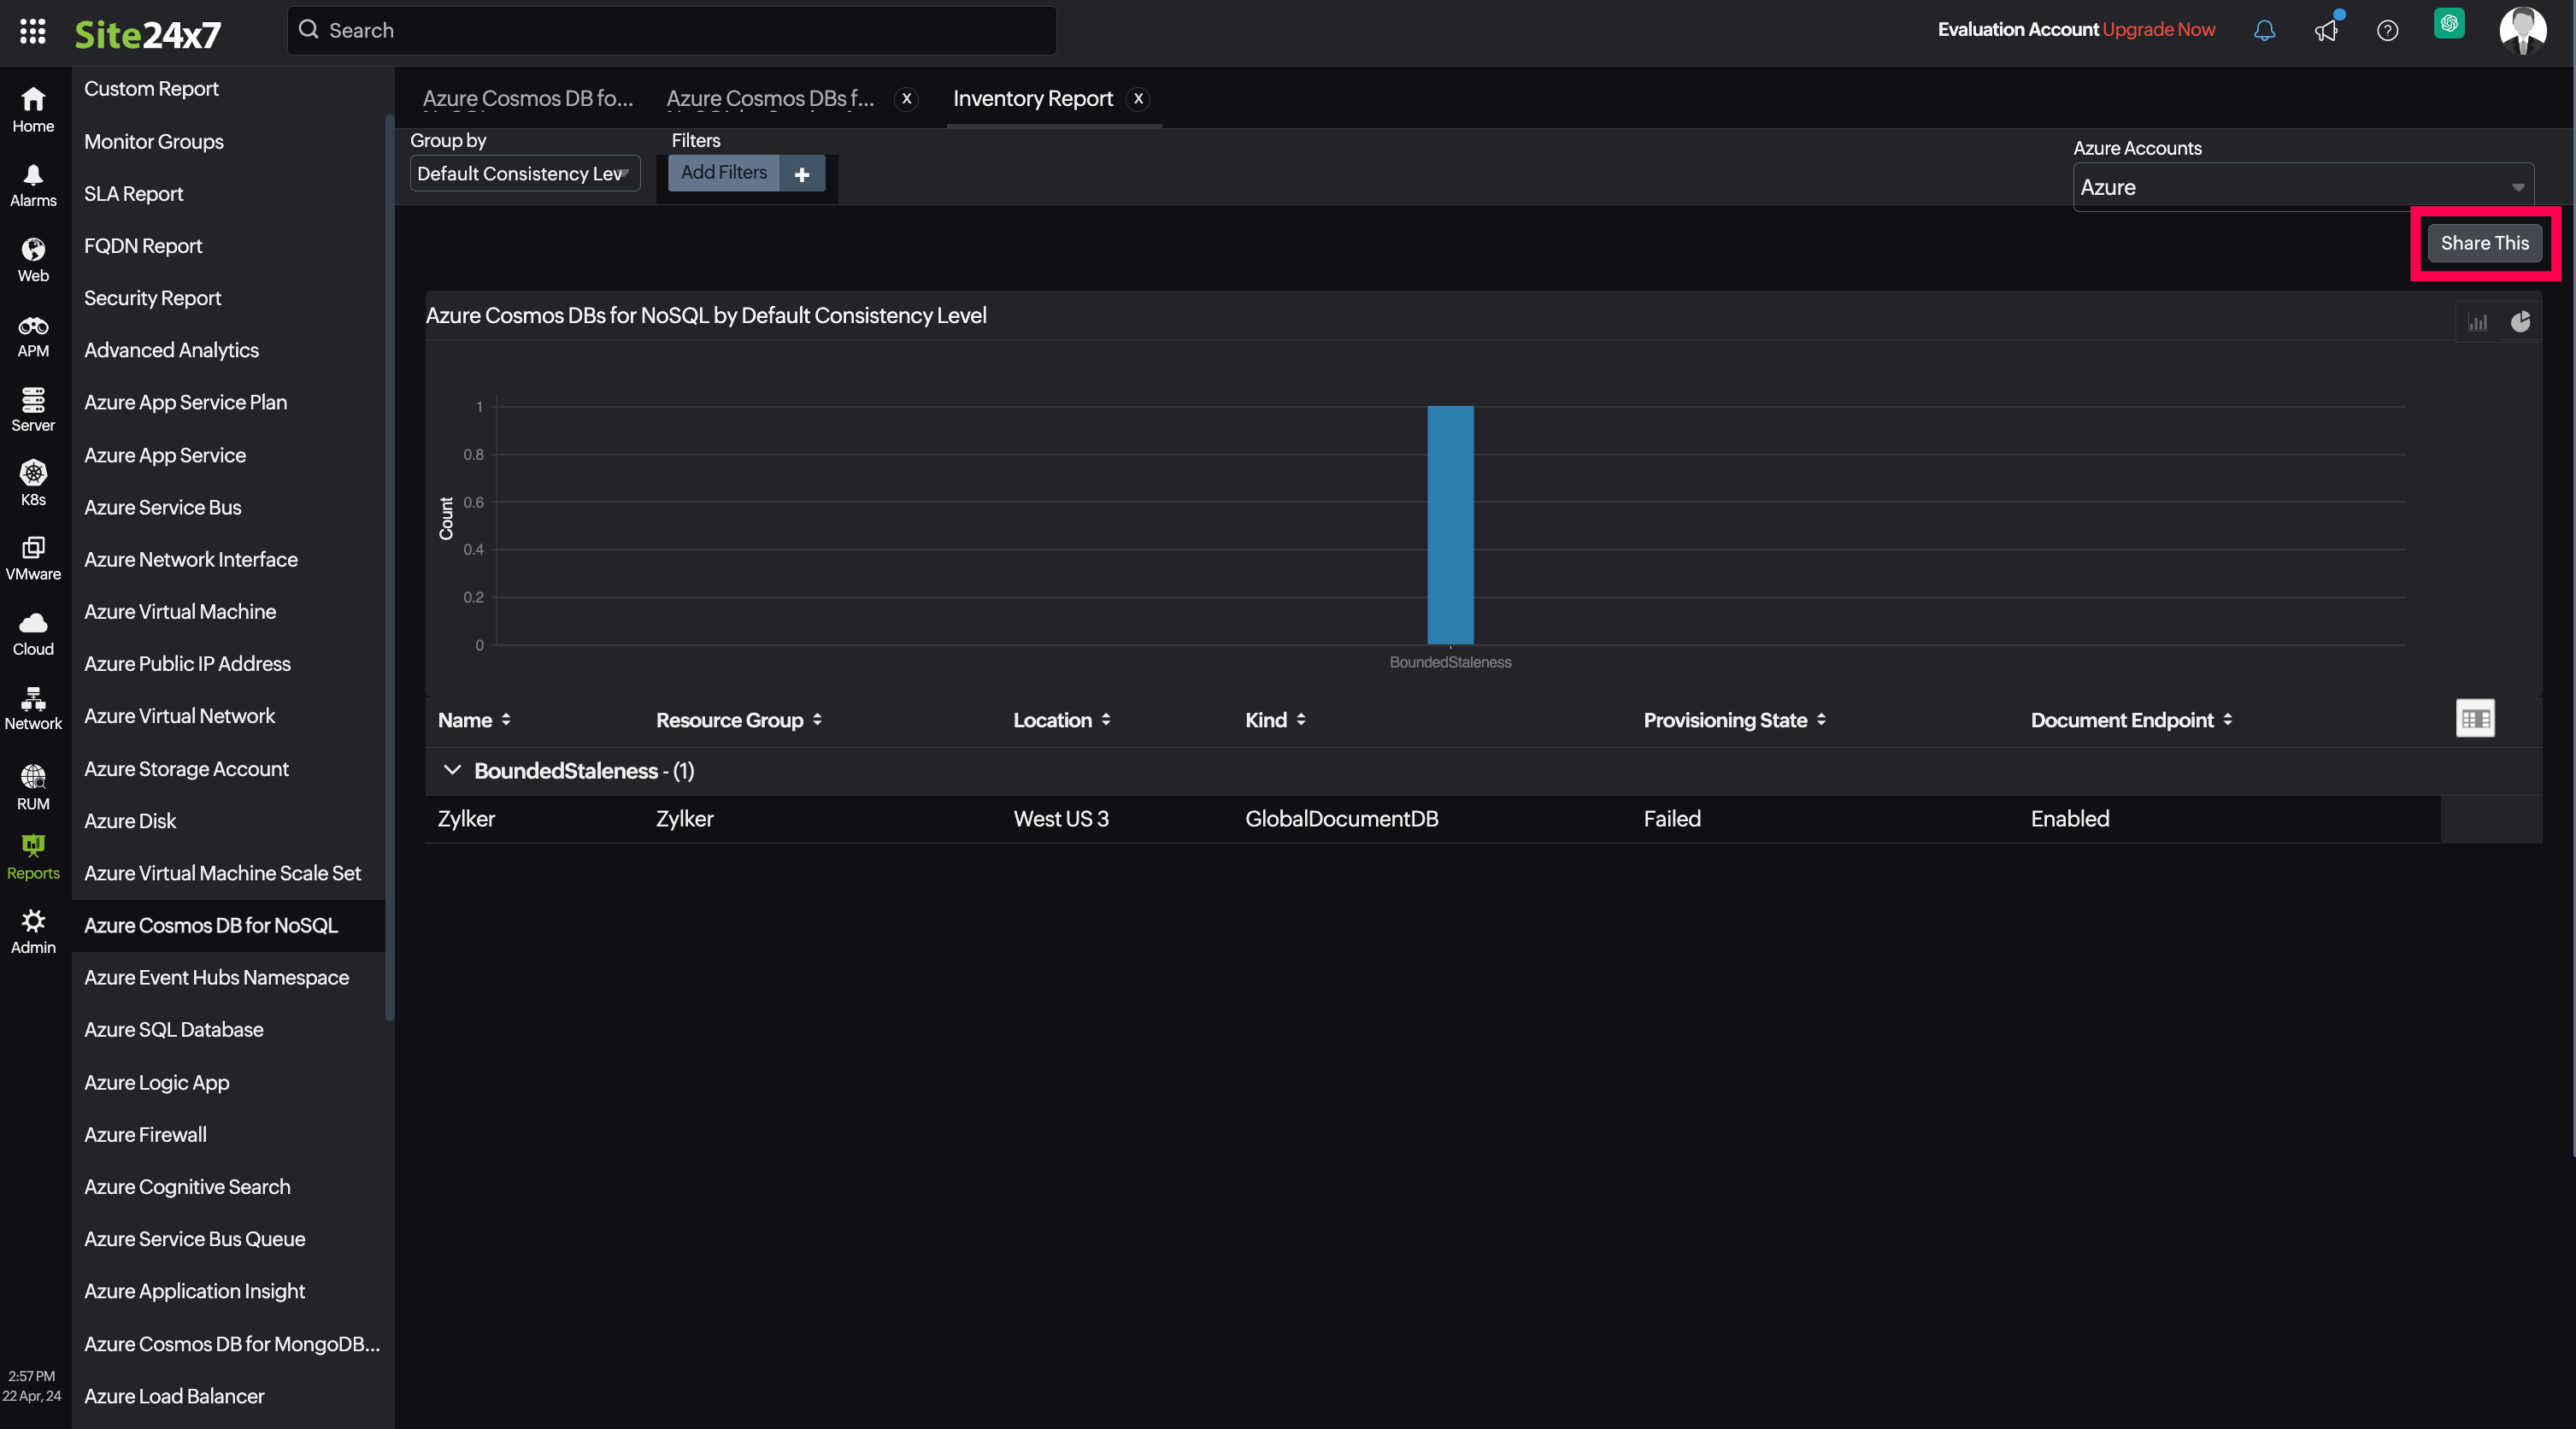
You can also schedule the Inventory Report by navigating to Reports > Azure Cosmos DB for NoSQL > Inventory Report and clicking the Share This button at the top-right corner. In the Schedule Report pop-up, choose the monitor, assign the desired frequency—daily, weekly, monthly, or quarterly—and receive the regular reports of your inventory details to the groups that you desire.

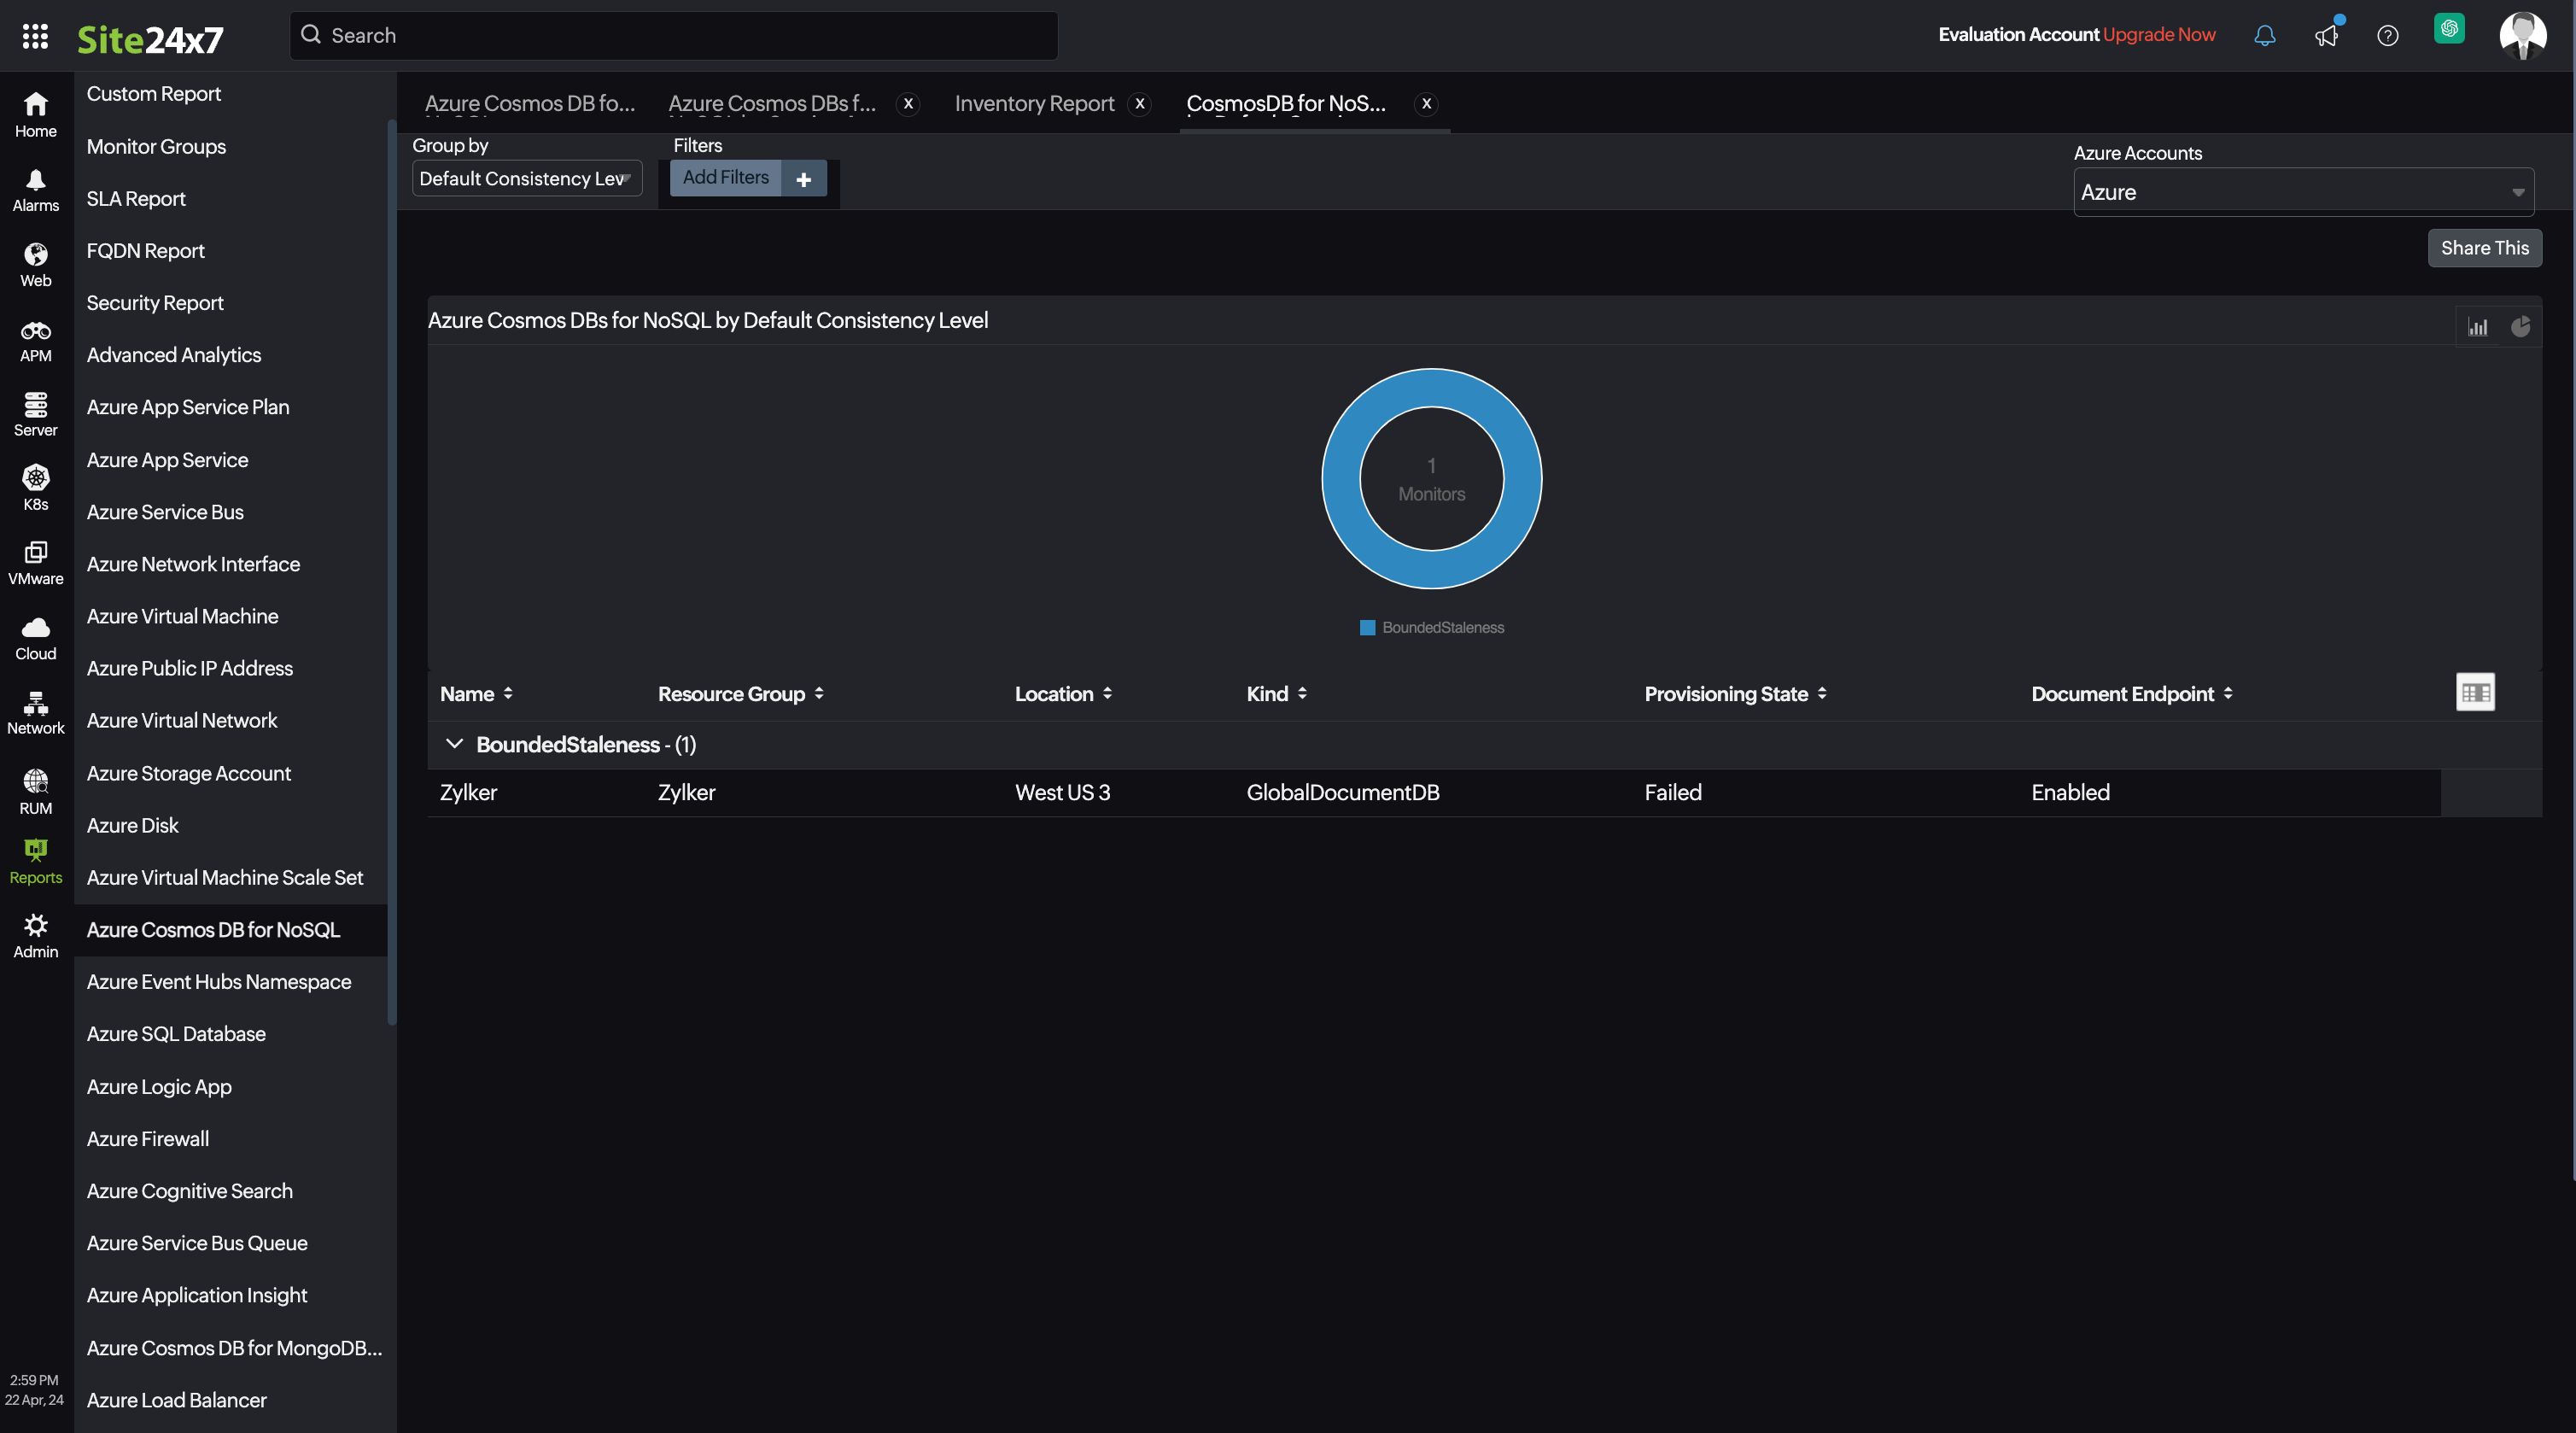
Site24x7 Azure Cosmos DB for NoSQL monitoring also provides CosmosDB for NoSQL by Default Consistency Level reports that will enable you to gain deeper insight into your resources.

Top N and Bottom N reports
- Service Availability
- Normalized RU Consumption
- Data Usage
- Index Usage
- Document Count
- Total Requests
- Provisioned Throughput

You can also view the reports from the Usage tab of the Azure Cosmos DB for NoSQL Monitor.
- Go to the Usage tab of the Azure Cosmos DB for NoSQL Monitor, and get the Availability Summary Report of the monitor by clicking on Availability.
- You can also find the Performance Report of the monitor by clicking on any chart title.
Site24x7's Cosmos DB for NoSQL monitoring interface
Get an overview of the availability and usage status of your Cosmos DB for NoSQL.
Usage:
The Usage tab will help you view the data and index usage of your resource as well as the availability status of your service and database. You can view metrics like Metadata Requests, Normalized RU Consumption, Provisioned Throughput, and many more.
Resilience:
With the Resilience tab, you can view the latency details, partition information, and the status of the regions.
SQL
The SQL tab will provide the details of your SQL database and containers, along with the throughput information.
Dedicated Gateway
The Dedicated Gateway tab contains dedicated gateway request information, integrated cache details, along with the CPU, and memory usage information.
Configuration Details
The Configuration Details tab provides the configuration details of your Cosmos DB for NoSQL. Details on the SQL EndPoint, Public Network Access, Default Consistency Level, Backup Policy Type, Automatic Failover, and more are included in this section.
Zia Forecast:
By leveraging the AI-driven Zia framework, you can examine resource consumption measurements through the forecast chart located in the Zia Forecast tab. This chart predicts upcoming performance metrics based on a 7-day historical data analysis, providing insights into the expected metric usage for the next seven days.
Outages:
The Outages tab provides the history of the Cosmos DB for NoSQL statuses, including Down, Trouble, and Critical.
Inventory:
The Inventory tab provides the licensing details, the Threshold and Availability Profiles, the Notification Profiles set, the set User Alert Group, and the monitor created time and modified time.
Log Report:
The Log Report tab lists all the logs collected during every data collection, along with their statuses.
Related links:
How to add an Azure monitor
How to integrate an Azure App Service monitor
How to integrate Azure Virtual Machine monitor
How to configure IT Automations for a monitor
How to add a Configuration Rule