
Amazon OpenSearch Service Monitoring Integration
Amazon OpenSearch Service (previously, Amazon Elasticsearch Service) makes it easy to deploy and operate OpenSearch for log analytics, data search and more. By monitoring Amazon OpenSearch Service with Site24x7 you can oversee the operational aspects like performance optimization.
Setup and configuration
- If you haven't done it already, enable access to your AWS resource by creating Site24x7 as an IAM user or by creating a cross-account IAM role between your account and Site24x7's AWS account. Learn more.
- Next, In the Integrate AWS Account page, please make sure the OpenSearch checkbox is selected in the Services to be discovered field. Learn more.
Policies and permissions
Please make sure the following read level actions are present in the IAM policy assigned to Site24x7 entity. Learn more.
- "es:DescribeElasticsearchDomain",
- "es:ListDomainNames",
- "es:ListTags",
- "logs:DescribeLogStreams",
- "logs:GetLogEvents",
- "es:DescribePackages"
Polling frequency
Site24x7 queries the AWS service level APIs and CloudWatch APIs as per the poll frequency set (1 minute to a day), to collect performance metrics. Learn more.
Threshold configuration
Go to Admin > Configuration Profiles > Threshold and Availability (+) > choose the monitor type. You can set threshold values for all the applicable metrics. Further, you can choose to mute inactive alerts in the threshold form for OpenSearch nodes.
Supported metrics
| Metric name | Description | Unit | Statistic |
| Cluster Status |
Green - Indicates that all index shards are allocated to nodes in the cluster. Yellow- Indicates that the primary shards for all indices are allocated to nodes in a cluster, but the replica shards for at least one index are not. Red- Indicates that the primary and replica shards of at least one index are not allocated to nodes in a cluster. |
State | Minimum |
| CPU Utilization | The percentage of CPU resources used for data nodes in the cluster.
Applicable as an OpenSearch node metric with a relevant statistic as Maximum. |
Percentage | Average |
| Storage | The free storage space and used space, for nodes and clusters. | MB for Nodes. GB for Clusters. |
Sum, Maximum, and Minimum |
| Nodes | The number of nodes in the Amazon OpenSearch cluster, including dedicated master nodes. | Count | Minimum |
| Documents |
Searcable documents- The total number of searchable documents across all indices in the cluster. Editable documents - The total number of documents marked for deletion across all indices in the cluster and do not appear in the search results. |
Count | Maximum |
| Cluster Index Writes Blocked |
Cluster block or accepts incoming requests. 0 - cluster is accepting requests, 1 - cluster is blocking requests. |
State | Maximum |
| JVM Memory Pressure | The percentage of the Java heap used for all data nodes in the cluster. | Percentage | Maximum |
| Automated snapshot failure | The number of failed automated snapshots for the cluster. | Count | Maximum |
| CPU Credit Balance | The remaining CPU credits available for data nodes in the cluster. | Count | Minimum |
| OpenSearchDashboardsHealthyNodes (previously KibanaHealthyNodes) | A health check for Kibana.
1- normal behavior, 0- Kibana is inaccessible. |
State | Minimum |
| KMS Key Error | KMS customer master key used to encrypt data at rest has been disabled. | State | Maximum |
| KMS Key Inaccessible | KMS customer master key used to encrypt data at rest has been deleted or revoked its grants to Amazon ES. | State | Maximum |
| Invalid Host Header Requests | The number of HTTP requests made to the OpenSearch cluster that included an invalid (or missing) host header. | Count | Sum |
| Elastcisearch Requests | The number of requests made to the OpenSearch cluster. | Count | Sum |
| Request Count | The number of requests to a domain and the HTTP response code (2xx, 3xx, 4xx, 5xx) for each request. | Count | Sum |
| Used Storage(%) | The percentage of disk space used by the OpenSearch node. Note: This metric is available only for OpenSearch node. |
Average | Percentage |
| Shards Active | The total number of active primary and replica shards. | Count | Maximum |
| Shards Active Primary | The number of active primary shards. | Count | Maximum |
| Shards Delayed Unassigned | The number of shards whose node allocation has been delayed by the timeout settings. | Count | Maximum |
| Shards Initializing | The number of shards that are under initialization. | Count | Sum |
| Shards Relocating | The number of shards that are under relocation. | Count | Sum |
| Shards Unassigned | The number of shards that are not allocated to nodes in the cluster. | Count | Maximum |
| Data Nodes | The total number of active and standby shards. | Count | Maximum |
| Old Gen JVM Memory Pressure | The maximum percentage of the Java heap used for the "old generation" on all data nodes in the cluster. | Percentage | Maximum |
| High Swap Usage | A value of 1 indicates that swapping due to page faults has potentially caused spikes in underlying disk usage during a specific time period. | State | Maximum |
| TLS Negotiation Error | The number of failed TLS handshake attempts between clients and the domain endpoint. | Count | Sum |
EBS volume metrics
| Attribute | Description | Unit | Statistic |
| Read Latency | The latency, in seconds, for read operations on EBS volumes. | Count/sec | Average |
| Write Latency | The latency, in seconds, for write operations on EBS volumes. | Count/sec | Average |
| Read Throughput | The throughput, in bytes per second, for read operations on EBS volumes. | MB/sec | Average |
| Write Throughput | The throughput, in bytes per second, for write operations on EBS volumes. | MB/sec | Average |
| Disk Queue Depth | The number of pending input and output (I/O) requests for an EBS volume. | Count | Maximum |
| Read IOPS | The number of input and output (I/O) operations per second for read operations on EBS volumes. | Count/sec | Average |
| Write IOPS | The number of input and output (I/O) operations per second for write operations on EBS volumes. | Count/sec | Average |
| IOPS Throttle | Indicates whether or not the number of input and output operations per second (IOPS) on the domain have been throttled. | State | Maximum |
| Throughput Throttle | Indicates whether or not disks have been throttled. | State | Maximum |
| Burst Balance | The percentage of input and output (I/O) credits remaining in the burst bucket for an EBS volume.
Applicable as an OpenSearch node metric. |
Percentage | Minimum |
| Read IOPS Micro Bursting | The number of input and output (I/O) operations per second for read operations on EBS volumes when micro-bursting is taken into consideration.
Applicable as an OpenSearch node metric. |
Count/sec | Average |
| Write IOPS Micro Bursting | The number of input and output (I/O) operations per second for write operations on EBS volumes when micro-bursting is taken into consideration.
Applicable as an OpenSearch node metric. |
Count/sec | Average |
| Read Throughput Micro Bursting | The throughput, in bytes per second, for read operations on EBS volumes when micro-bursting is taken into consideration.
Applicable as an OpenSearch node metric. |
MB/sec | Average |
| Write Throughput Micro Bursting | The throughput, in bytes per second, for write operations on EBS volumes when micro-bursting is taken into consideration.
Applicable as an OpenSearch node metric. |
MB/sec | Average |
| Volume Stalled IO Check | The status of your EBS volumes, used to determine when they are impaired.
Applicable as an OpenSearch node metric. |
State | Maximum |
Dedicated master node metrics
| Attribute | Description | Unit | Statistic |
| Master CPU Utilization | The maximum percentage of CPU resources used by the dedicated master nodes. | Percentage | Average |
| Master Free Storage Space | Free storage space for master node.
Applicable as an OpenSearch node metric. |
MB | Average |
| Master JVM Memory Pressure | The maximum percentage of the Java heap used for all dedicated master nodes in the cluster. | Percentage | Maximum |
| Master CPU Credit Balance | The CPU credits available for dedicated master nodes in the cluster. | Count | Minimum |
| Master Reachable From Node | A health check for MasterNotDiscovered exceptions. A value of 1 indicates normal behavior. A value of 0 indicates that cluster health is failing. | Count | Sum |
| Master Sys Memory Utilization | The percentage of the master node's memory that is in use. | Percentage | Maximum |
| Master Old Gen JVM Memory Pressure | The maximum percentage of the Java heap used for the "old generation" per master node. | Percentage | Maximum |
Dedicated coordinator node metrics
| Attribute | Description | Unit | Statistic |
| Coordinator CPU Utilization | The maximum percentage of CPU resources used by the dedicated coordinator nodes. | Percentage | Maximum |
| Coordinator Free Storage Space | The free storage space for the dedicated coordinator nodes. This value is always 0, as the service does not use coordinator nodes as data nodes. | MB | Minimum |
| Coordinator JVM Memory Pressure | The maximum percentage of the Java heap used for all dedicated coordinator nodes in the cluster. | Percentage | Maximum |
| Coordinator Old Gen JVM Memory Pressure | The maximum percentage of the Java heap used for the "old generation" per coordinator node. | Percentage | Maximum |
| Coordinator Sys Memory Utilization | The percentage of the coordinator node's memory that is in use. | Percentage | Maximum |
Instance metrics
| Attribute | Description | Unit | Statistic |
| Indexing Latency | The average time, in milliseconds, that it takes a shard to complete an indexing operation.
Applicable as an OpenSearch node metric. |
Milliseconds | Average |
| Indexing Rate | The number of indexing operations per minute. A single call to the _bulk API that adds two documents and updates two counts as four operations, which might be spread across one or more nodes. If that index has one or more replicas, other nodes in the cluster also record a total of four indexing operations. Document deletions do not count towards this metric.
Applicable as an OpenSearch node metric. |
Ops/min | Average |
| Search Latency | The average time, in milliseconds, that it takes a shard on a data node to complete a search operation.
Applicable as an OpenSearch node metric. |
Milliseconds | Average |
| Search Rate | The total number of search requests per minute for all shards on a data node. A single call to the _search API might return results from many different shards. If five of these shards are on one node, the node would report 5 for this metric, even though the client only made one request.
Applicable as an OpenSearch node metric. |
Ops/min | Average |
| Sys Memory Utilization | The percentage of the instance's memory that is in use.
Applicable as an OpenSearch node metric with a relevant statistic as Maximum. |
Percentage | Maximum |
| JVMGC Young Collection Count | The number of times that "young generation" garbage collection has run. A large, ever-growing number of runs is a normal part of cluster operations.
Applicable as an OpenSearch node metric with a relevant statistic as Maximum. |
Count | Sum |
| JVMGC Young Collection Time | The amount of time, in milliseconds, that the cluster has spent performing "young generation" garbage collection.
Applicable as an OpenSearch node metric with a relevant statistic as Maximum. |
Milliseconds | Average |
| JVMGC Old Collection Count | The number of times that "old generation" garbage collection has run. In a cluster with sufficient resources, this number should remain small and grow infrequently.
Applicable as an OpenSearch node metric with a relevant statistic as Maximum. |
Count | Sum |
| JVMGC Old Collection Time | The amount of time, in milliseconds, that the cluster has spent performing "old generation" garbage collection.
Applicable as an OpenSearch node metric with a relevant statistic as Maximum. |
Millisecond | Average |
| Threadpool Force_merge Queue | The number of queued tasks in the force merge thread pool.
Applicable as an OpenSearch node metric with a relevant statistic as Maximum. |
Count | Sum |
| Threadpool Force_merge Rejected | The number of rejected tasks in the force merge thread pool. If this number continually grows, consider scaling your cluster..
Applicable as an OpenSearch node metric with a relevant statistic as Maximum. |
Count | Sum |
| Threadpool Force_merge Threads | The size of the force merge thread pool.
Applicable as an OpenSearch node metric with a relevant statistic as Maximum. |
Count | Average |
| Threadpool Index Queue | The number of queued tasks in the index thread pool.
Applicable as an OpenSearch node metric with a relevant statistic as Maximum. |
Count | Sum |
| Threadpool Index Rejected | The number of rejected tasks in the index thread pool. If this number continually grows, consider scaling your cluster.
Applicable as an OpenSearch node metric with a relevant statistic as Maximum. |
Count | Sum |
| Threadpool Index Threads | The number of queued tasks in the search thread pool.
Applicable as an OpenSearch node metric with a relevant statistic as Maximum. |
Count | Sum |
| Threadpool Search Queue | The number of queued tasks in the search thread pool.
Applicable as an OpenSearch node metric with a relevant statistic as Maximum. |
Count | Sum |
| Threadpool Search Rejected | The number of rejected tasks in the search thread pool.
Applicable as an OpenSearch node metric with a relevant statistic as Maximum. |
Count | Sum |
| Threadpool Search Threads | The number of rejected tasks in the search thread pool.
Applicable as an OpenSearch node metric with a relevant statistic as Maximum. |
Count | Average |
| Threadpool Bulk Queue | The number of queued tasks in the bulk thread pool. If the queue size is consistently high, consider scaling your cluster.
Applicable as an OpenSearch node metric with a relevant statistic as Maximum. |
Count | Sum |
| Threadpool Bulk Rejected | The number of rejected tasks in the bulk thread pool.
Applicable as an OpenSearch node metric with a relevant statistic as Maximum. |
Count | Sum |
| Threadpool Bulk Threads | The number of rejected tasks in the search thread pool.
Applicable as an OpenSearch node metric with a relevant statistic as Maximum. |
Count | Average |
| Threadpool Write Threads | The size of the write thread pool.
Applicable as an OpenSearch node metric with a relevant statistic as Maximum. |
Count | Average |
| Threadpool Write Rejected | The number of rejected tasks in the write thread pool.
Applicable as an OpenSearch node metric with a relevant statistic as Maximum. |
Count | Sum |
| Threadpool Write Queue | The number of queued tasks in the write thread pool.
Applicable as an OpenSearch node metric with a relevant statistic as Maximum. |
Count | Sum |
| Concurrent Search Latency | The difference in total time, in milliseconds, taken by all searches using concurrent segment search in a node between minute N and minute (N-1).
Applicable as an OpenSearch node metric. |
Milliseconds | Average |
| Concurrent Search Rate | The total number of search requests using concurrent segment search per minute for all shards on a data node.
Applicable as an OpenSearch node metric. |
Ops/min | Average |
| Fetch Latency | The difference in total time, in milliseconds, taken by all shard fetch operations in a node between minute N and minute (N-1).
Applicable as an OpenSearch node metric. |
Milliseconds | Average |
| Fetch Rate | The total number of shard fetch operations per minute for all shards on a data node.
Applicable as an OpenSearch node metric. |
Ops/min | Average |
| Scroll Current | The number of shard scroll operations that are currently running.
Applicable as an OpenSearch node metric with a relevant statistic as Average. |
Count | Sum |
| Scroll Total | The total number of shard scroll operations per minute for all shards on a data node.
Applicable as an OpenSearch node metric with a relevant statistic as Average. |
Count | Sum |
| Segment Count | The number of segments on a data node.
Applicable as an OpenSearch node metric with a relevant statistic as Maximum. |
Count | Sum |
| Open Contexts | The number of open search contexts.
Applicable as an OpenSearch node metric with a relevant statistic as Average. |
Count | Sum |
| Thread Count | The total number of threads currently being utilized by the OpenSearch process.
Applicable as an OpenSearch node metric with a relevant statistic as Average. |
Count | Sum |
| Threadpool Index Searcher Queue | The number of queued tasks in the index searcher thread pool.
Applicable as an OpenSearch node metric with a relevant statistic as Maximum. |
Count | Sum |
| Threadpool Index Searcher Rejected | The number of rejected tasks in the index searcher thread pool.
Applicable as an OpenSearch node metric with a relevant statistic as Maximum. |
Count | Sum |
| Threadpool Index Searcher Threads | The size of the index searcher thread pool.
Applicable as an OpenSearch node metric with a relevant statistic as Maximum. |
Count | Average |
| Shard Reactivate Count | The total number of times that all shards have been activated from an idle state.
Applicable as an OpenSearch node metric. |
Count | Sum |
| Primary Write Rejected | The total number of rejections that happened on the primary shards due to indexing pressure, since the last OpenSearch Service process startup.
Applicable as an OpenSearch node metric with a relevant statistic as Maximum. |
Count | Sum |
| Replica Write Rejected | The total number of rejections that happened on the replica shards due to indexing pressure, since the last OpenSearch Service process startup.
Applicable as an OpenSearch node metric with a relevant statistic as Maximum. |
Count | Sum |
| Coordinating Write Rejected | The total number of rejections that happened on the coordinating node due to indexing pressure, since the last OpenSearch Service process startup.
Applicable as an OpenSearch node metric with a relevant statistic as Maximum. |
Count | Sum |
OpenSearch Dashboards metrics
| Attribute | Description | Unit | Statistic |
| OpenSearch Dashboards Healthy Node | A health check for the individual OpenSearch Dashboards node.
Applicable as an OpenSearch node metric. |
State | Minimum |
| OpenSearch Dashboards Concurrent Connections | The number of active concurrent connections to OpenSearch Dashboards.
Applicable as an OpenSearch node metric with a relevant statistic as Maximum. |
Count | Sum |
| OpenSearch Dashboards Heap Total | The amount of heap memory allocated to OpenSearch Dashboards.
Applicable as an OpenSearch node metric. |
MB | Maximum |
| OpenSearch Dashboards Heap Used | The absolute amount of heap memory used by OpenSearch Dashboards.
Applicable as an OpenSearch node metric. |
MB | Maximum |
| OpenSearch Dashboards Heap Utilization | The maximum percentage of available heap memory used by OpenSearch Dashboards.
Applicable as an OpenSearch node metric. |
Percentage | Maximum |
| OpenSearch Dashboards OS 1 Minute Load | The one-minute CPU load average for OpenSearch Dashboards.
Applicable as an OpenSearch node metric. |
Count | Average |
| OpenSearch Dashboards Request Total | The total count of HTTP requests made to OpenSearch Dashboards.
Applicable as an OpenSearch node metric. |
Count | Sum |
| OpenSearch Dashboards Response Times Max | The maximum amount of time, in milliseconds, that it takes for OpenSearch Dashboards to respond to a request.
Applicable as an OpenSearch node metric. |
Milliseconds | Maximum |
| OpenSearch Dashboards Reporting Request Count | The total number of requests to generate OpenSearch Dashboards reports. | Count | Sum |
| OpenSearch Dashboards Reporting Success Count | The number of successful requests to generate OpenSearch Dashboards reports. | Count | Sum |
| OpenSearch Dashboards Reporting Failed Request Sys Err Count | The number of requests to generate OpenSearch Dashboards reports that failed due to server problems or feature limitations. | Count | Sum |
| OpenSearch Dashboards Reporting Failed Request User Err Count | The number of requests to generate OpenSearch Dashboards reports that failed due to client issues. | Count | Sum |
Ultra warm metrics
| Attribute | Description | Unit | Statistic |
| Warm CPU Utilization | The percentage of CPU usage for UltraWarm nodes in the cluster. | Percentage | Average |
| Warm Free Storage Space | The amount of free warm storage space in MB. | MB | Average |
| Warm JVM Memory Pressure | The maximum percentage of the Java heap used for the UltraWarm nodes. | Percentage | Max |
| Warm Searchable Documents | The total number of searchable documents across all warm indices in the cluster. | Count | Sum |
| Warm Search Latency | The average time, in milliseconds, that it takes a shard on an UltraWarm node to complete a search operation. | Milliseconds | Average |
| Warm Search Rate | The total number of search requests per minute for all shards on an UltraWarm node. A single call to the _search API might return results from many different shards. | Ops/min | Average |
| Warm Storage Space Utilization | The total amount of warm storage space that the cluster is using. | MB | Maximum |
| Hot Storage Space Utilization | The total amount of hot storage space that the cluster is using. | MB | Maximum |
| Warm Sys Memory Utilization | The percentage of the warm node's memory that is in use. | Percentage | Maximum |
| Hot To Warm Migration Queue Size | The number of indices currently waiting to migrate from hot to warm storage. | Count | Maximum |
| Warm To Hot Migration Queue Size | The number of indices currently waiting to migrate from warm to hot storage. | Count | Maximum |
| Hot To Warm Migration Failure Count | The total number of failed hot to warm migrations. | Count | Sum |
| Hot To Warm Migration Success Count | The total number of successful hot to warm migrations. | Count | Sum |
| Hot To Warm Migration Force Merge Latency | The average latency of the force merge stage of the migration process. | Milliseconds | Average |
| Hot To Warm Migration Processing Latency | The average latency of successful hot to warm migrations, not including the time spent in the queue. | Milliseconds | Average |
| Hot To Warm Migration Snapshot Latency | The average latency of the snapshot stage of the migration process. | Milliseconds | Average |
| Hot To Warm Migration Success Latency | The average latency of successful hot to warm migrations, including the time spent in the queue. | Milliseconds | Average |
| Warm Indexing Latency | The difference in total time, in milliseconds, taken by all indexing operations in a warm node between minute N and minute (N-1). | Milliseconds | Average |
| Warm Indexing Rate | The number of indexing operations on warm nodes per minute. | Ops/min | Average |
| Warm Concurrent Search Latency | The difference in total time, in milliseconds, taken by all searches using concurrent segment search in a warm node between minute N and minute (N-1). | Milliseconds | Average |
| Warm Concurrent Search Rate | The total number of search requests using concurrent segment search per minute for all shards on a warm node. | Ops/min | Maximum |
| Warm Old Gen JVM Memory Pressure | The maximum percentage of the Java heap used for the "old generation" per warm node. | Percentage | Maximum |
| Warm Threadpool Indexing Queue | The number of queued tasks in the index thread pool. | Count | Sum |
| Warm Threadpool Indexing Rejected | The number of rejected tasks in the index thread pool. | Count | Sum |
| Warm Threadpool Indexing Threads | The size of the index thread pool. | Count | Average |
| Warm Threadpool Index Searcher Queue | The number of queued tasks in the warm index searcher thread pool. | Count | Sum |
| Warm Threadpool Index Searcher Rejected | The number of rejected tasks in the warm index searcher thread pool. | Count | Sum |
| Warm Threadpool Index Searcher Threads | The size of the warm index searcher thread pool. | Count | Average |
Cold storage metrics
| Attribute | Description | Unit | Statistic |
| Cold Storage Space Utilization | The total amount of cold storage space that the cluster is using. | GB | Maximum |
| Cold To Warm Migration Failure Count | The total number of failed cold to warm migrations. | Count | Sum |
| Cold To Warm Migration Latency | The amount of time taken for successful cold to warm migrations to complete. | Milliseconds | Average |
| Cold To Warm Migration Queue Size | The number of indices currently waiting to migrate from cold to warm storage. | Count | Maximum |
| Cold To Warm Migration Success Count | The total number of successful cold to warm migrations. | Count | Sum |
| Warm To Cold Migration Failure Count | The total number of failed warm to cold migrations. | Count | Sum |
| Warm To Cold Migration Latency | The amount of time taken for successful warm to cold migrations to complete. | Milliseconds | Average |
| Warm To Cold Migration Queue Size | The number of indices currently waiting to migrate from warm to cold storage. | Count | Maximum |
| Warm To Cold Migration Success Count | The total number of successful warm to cold migrations. | Count | Sum |
Vector search and native memory metrics
| Attribute | Description | Unit | Statistic |
| Native Memory Pressure | The percentage of native (off-heap) memory in use on the node. | Percentage | Maximum |
| Native Runtime Resident Memory | The amount of resident memory consumed by the native analytics engine on the node. | MB | Maximum |
| Native Search Runtime CPU Utilization | The CPU utilization, as a percentage, of the DataFusion query execution engine on the node. | Percentage | Maximum |
| Threadpool Native Search CPU Queue | The number of queued tasks in the native search CPU thread pool. | Count | Maximum |
| Threadpool Native Search CPU Threads | The size of the native search CPU thread pool. | Count | Maximum |
| Vector Index Build Acceleration OCU | The number of OpenSearch Compute Units (OCUs) used to accelerate vector indexing. | Count | Sum |
Forecast
Estimate future values of the following OpenSearch Domain performance metrics and make informed decisions about adding capacity or scaling your AWS infrastructure.
- Deleted Documents
- CPU Utilization
- Free Storage Usage
- Cluster Used Space
- CPU Credit Balance
- Elastisearch Requests
- OpenSearch Requests
- Disk Queue Depth
- Read IOPS
- JVMGC Old Collection Time
- JVMGC Old Collection Count
- Sys Memory Utilization
Similarly, you can also view the forecast for the following metrics of OpenSearch Domain Node:
- CPU Utilization
- Free Storage Space
- Cluster Used Space
- Search Rate
- Sys Memory Utilization
- JVMGC Old Collection Time
- JVMGC Old Collection Count
OpenSearch monitoring interface
Summary
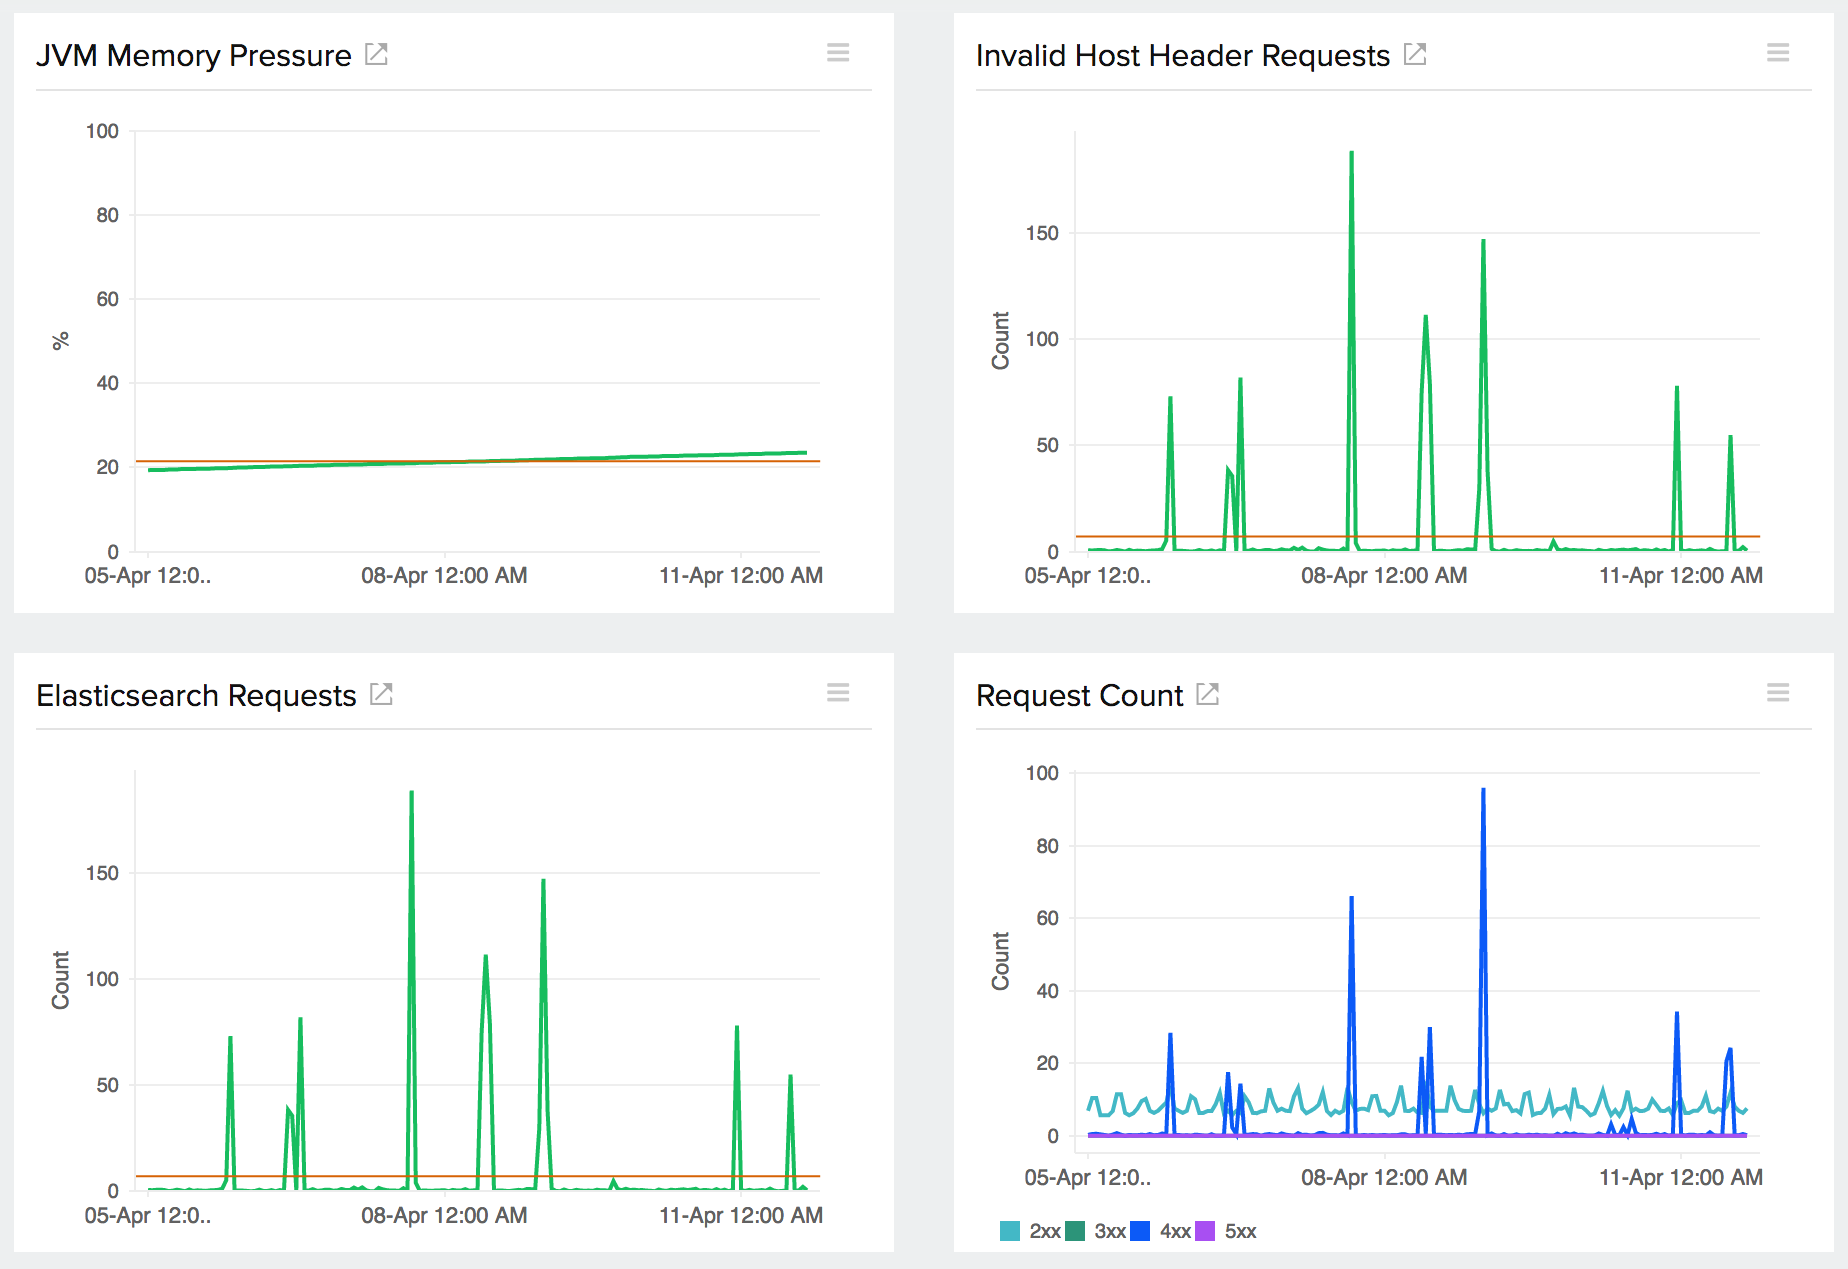
View the performance metrics of the OpenSearch service displayed as time series charts.
Volume details
Detailed graphs of EBS volumes metrics such as Read/Write IOPS, Read/Write latency and Read/Write throughput.
-
On this page
- Setup and configuration
- Policies and permissions
- Polling frequency
- Threshold configuration
- Supported metrics
- EBS volume metrics
- Dedicated master node metrics
- Dedicated coordinator node metrics
- Instance metrics
- OpenSearch Dashboards metrics
- Ultra warm metrics
- Cold storage metrics
- Vector search and native memory metrics
- Forecast
- OpenSearch monitoring interface