by Deva Priya
We’ve simplified the way you discover and set up application performance monitoring in Site24x7.
Previously, the setup options for different APM features were available separately within their respective features. With the new Add APM Insight Monitor page, all the available APM monitoring options are brought together in a single, unified view.
This makes it easier to explore the different monitoring approaches available and choose the one that best fits your application and deployment environment.
Explore your APM monitoring options
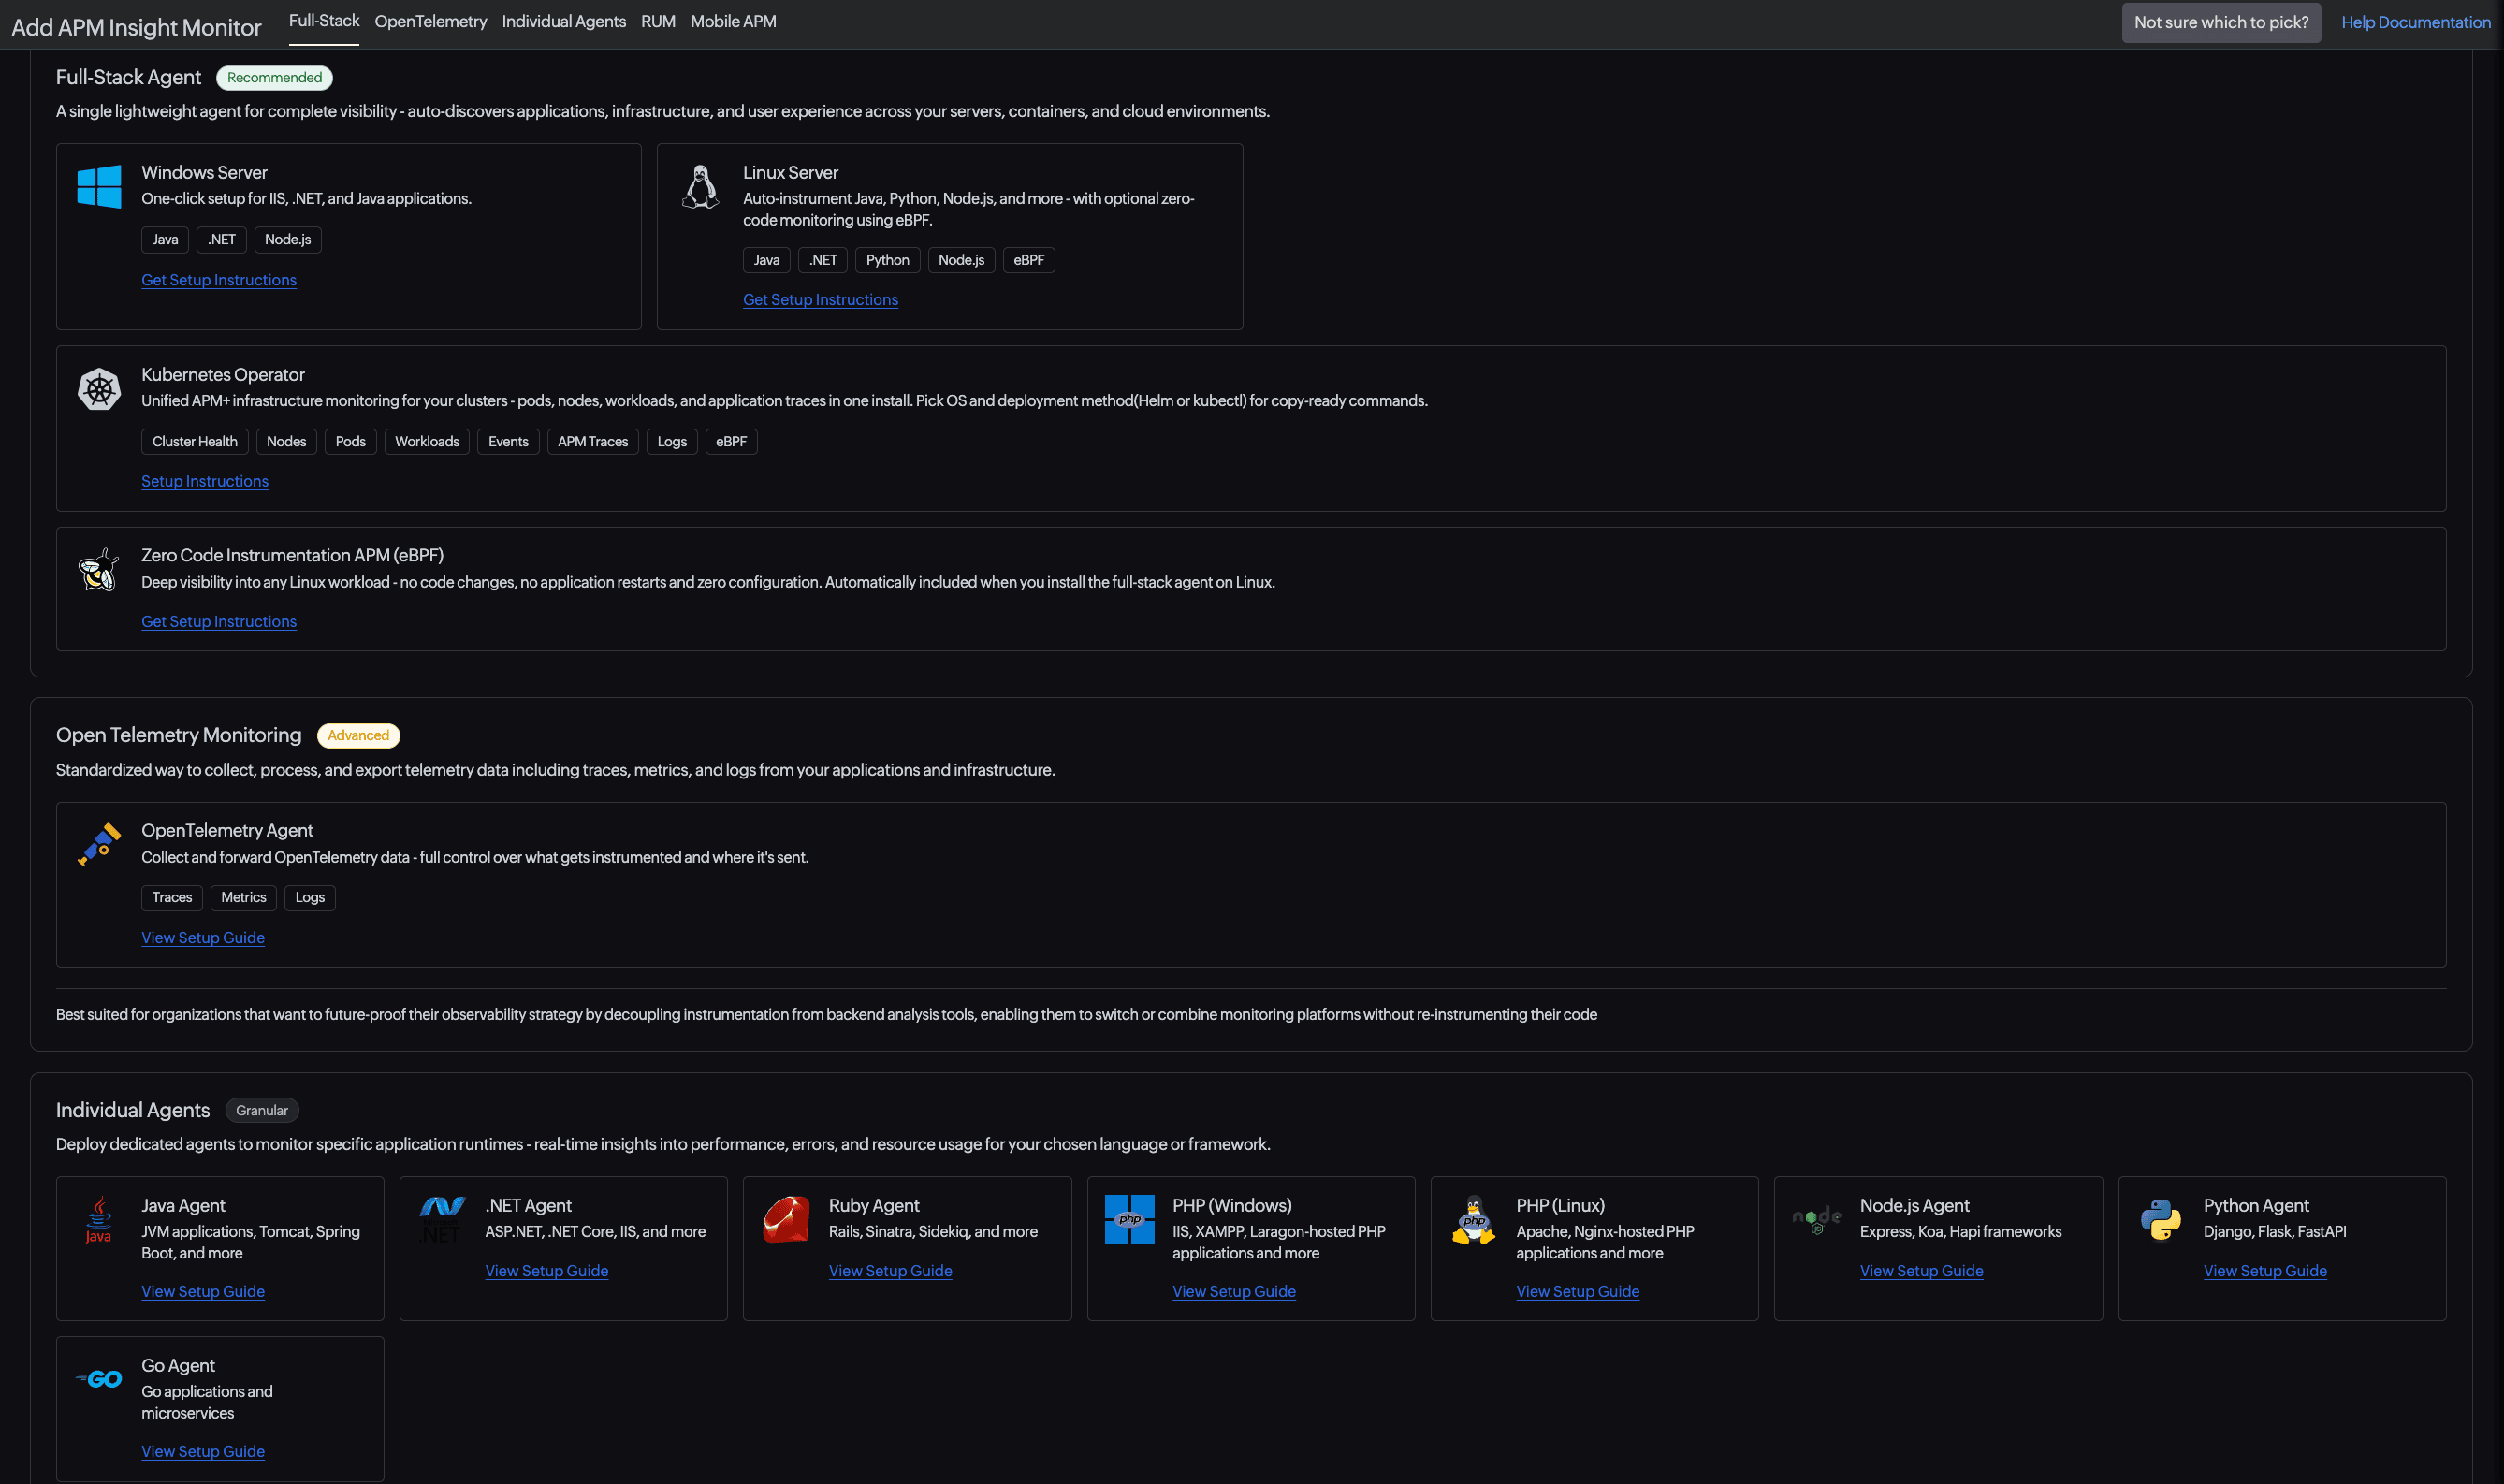
The unified page provides quick access to:
- Full-Stack Agent: Set up comprehensive application and infrastructure monitoring for Windows, Linux, and Kubernetes environments, including zero-code instrumentation using eBPF (Linux).
- OpenTelemetry: Configure standards-based collection of traces, metrics, and logs from your applications and infrastructure.
- Individual Agents: Set up dedicated APM agents for Java, .NET, Ruby, PHP, Node.js, Python, and Go applications.
- Real user monitoring (RUM): Monitor real-user experience for traditional and single-page web applications.
- Mobile APM: Monitor native Android and iOS applications, as well as cross-platform applications built using React Native and Flutter.
The Full-Stack tab provides the complete view, allowing you to scroll through all the available options. You can also select OpenTelemetry, Individual Agents, RUM, or Mobile APM at the top of the page to jump directly to the corresponding section.
Get started
Navigate to Admin > Add Monitor and select APM Insight Application under Application Performance Monitoring to explore the unified Add Monitor experience.
For more details, please refer to our help documentation.
Have questions or suggestions? Share them in the comments—we’d love to hear from you!
Happy monitoring,
The Site24x7 team
Like (1)
Reply
Replies (0)