Why choose Site24x7 for Nutanix monitoring?
Full stack observability
Monitor your Nutanix HCI alongside servers, networks, and clouds. Break down silos and correlate performance across your entire IT stack.
AI-powered insights
Leverage AIOps to detect anomalies in cluster performance. Forecast storage and capacity needs before you run out of resources.
Fastest time-to-value
Start monitoring in minutes. Auto-discover clusters, hosts, and VMs using your Prism credentials. No complex configuration required.
Unified Nutanix monitoring architecture
Effective management requires more than just HCI metrics. Site24x7 connects directly to Nutanix Prism APIs for infrastructure stats while simultaneously monitoring the applications running inside your VMs. This dual approach ensures you understand the "why" behind performance issues—whether it's resource contention at the storage layer or a hung process at the application layer.
Automated discovery and mapping
Onboarding your Nutanix infrastructure is effortless. Simply provide your Prism credentials, and Site24x7 will automatically discover all associated clusters, hosts, and VMs. Our intelligent mapping visualizes the relationships between these components, helping you understand dependencies and the blast radius of any potential failure.
Capacity planning and forecasting
Don't let resource exhaustion surprise you. Leverage predictive analytics to forecast growth in storage, compute, and memory usage. Our capacity planning reports help you decide when to add nodes to your cluster, tracking key indicators like storage controller data transfer rates and memory deduplication efficiency.
Intelligent alerting and anomaly detection
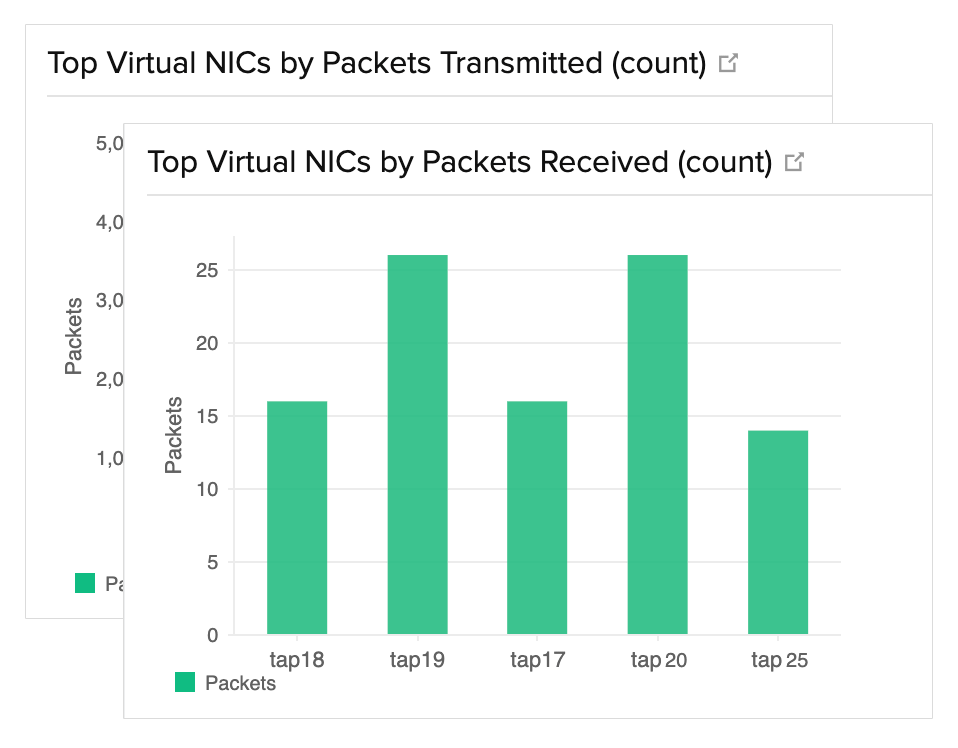
Reduce alert fatigue with AI-powered anomaly detection that learns your baseline performance. Set dynamic thresholds for critical metrics—including child-level stats for virtual disks and NICs. Receive notifications via SMS, email, voice call, or integrations like Slack, Microsoft Teams, and Jira only when it matters.
Comprehensive reports and dashboards
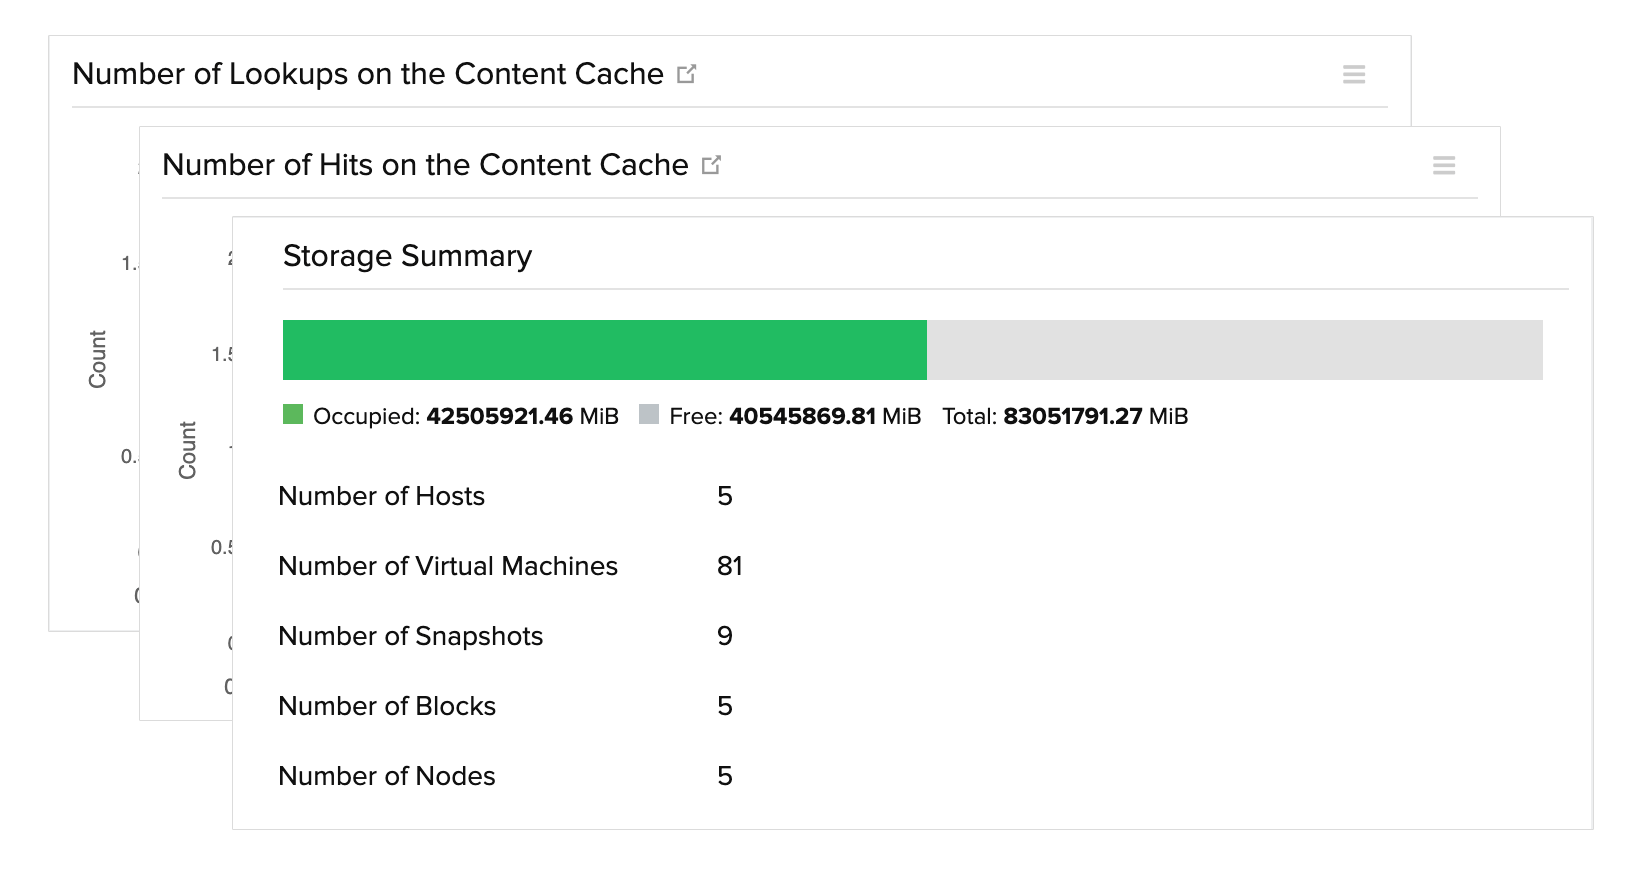
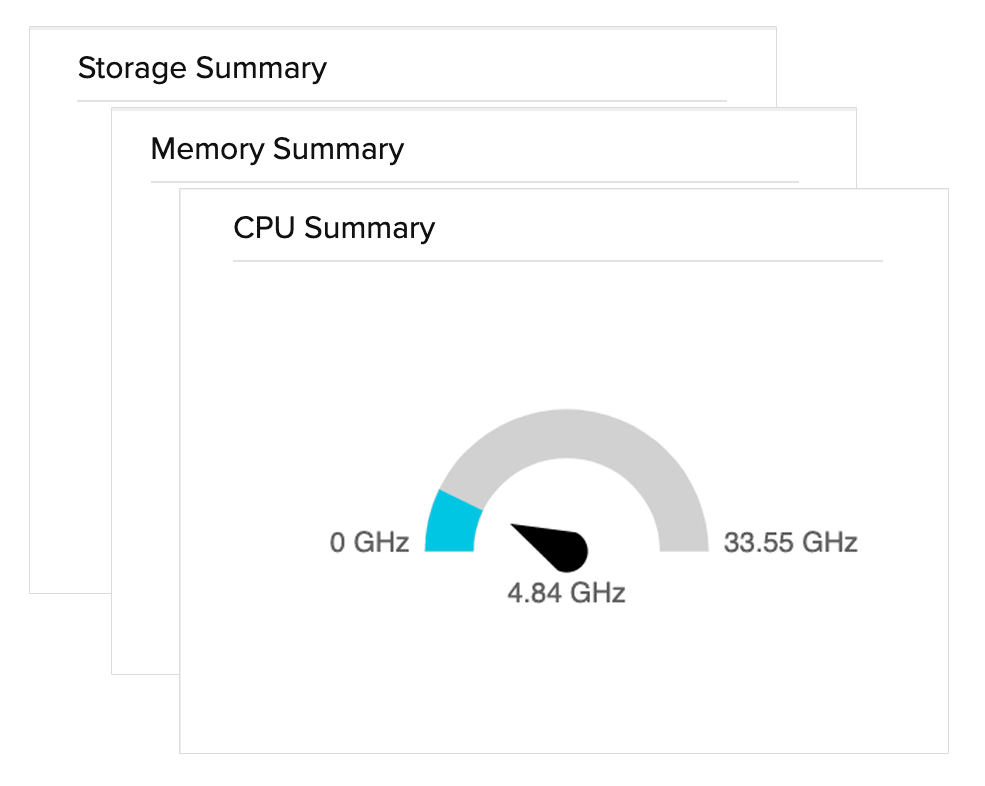
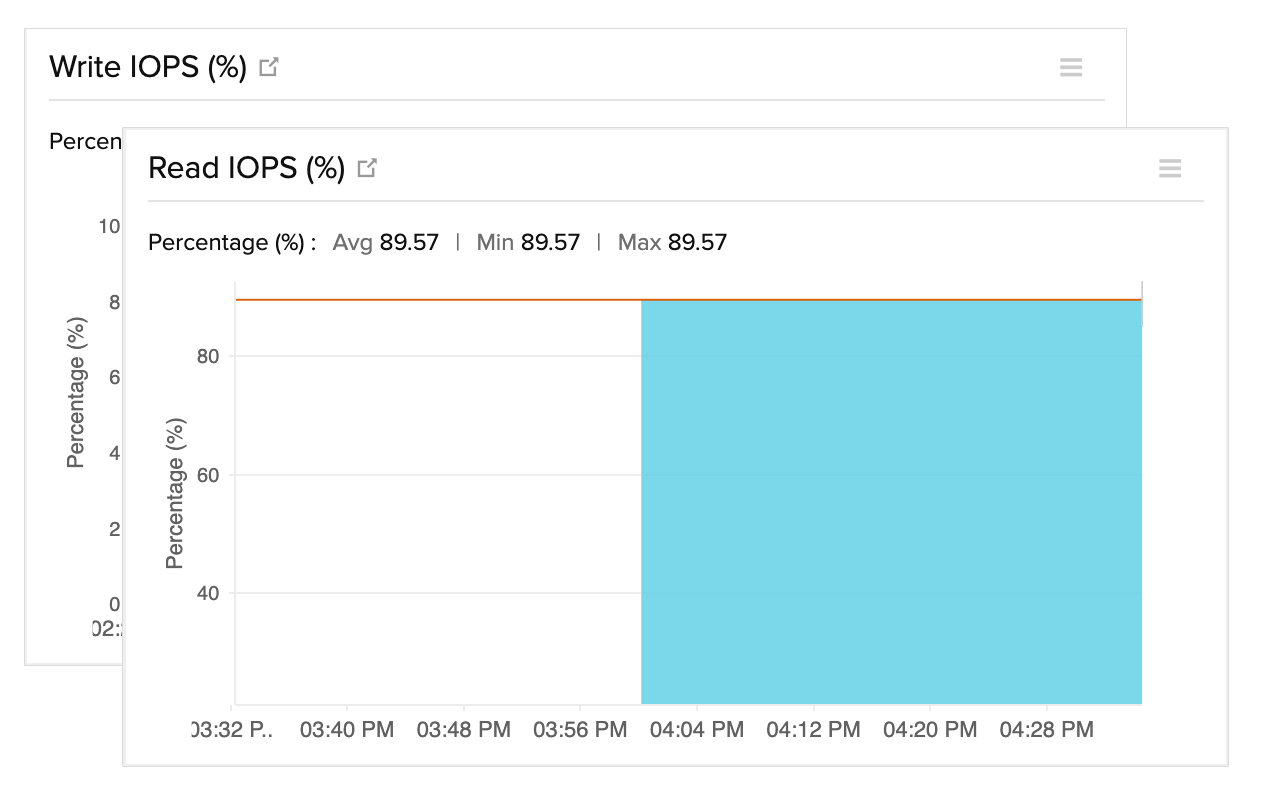
Visualize your HCI health with pre-built dashboards or create custom views tailored to your operations team. Generate detailed reports on cluster inventory, VM sprawl, and historical performance trends. Share these insights with stakeholders to prove SLAs and justify infrastructure investments.
Deep application monitoring inside VMs
While Prism provides excellent infrastructure visibility, it doesn't always show what's happening inside the guest OS. Site24x7 bridges this gap by allowing you to install agents within your Nutanix VMs. Monitor mission-critical applications (database queries, web server response times, custom services) alongside your hypervisor metrics for total stack observability.
Frequently asked questions
How does Site24x7 monitor Nutanix environments?
Site24x7 leverages the Nutanix Prism API to fetch performance metrics from your clusters, hosts, and VMs. It uses a lightweight On-Premise Poller to securely communicate with your Nutanix infrastructure.
What key Nutanix metrics should I track?
Essential metrics include cluster-wide IOPS, latency, and bandwidth usage. You should also monitor storage controller stats, CPU ready time for VMs, and memory ballooning to prevent resource contention.
Does Site24x7 support Nutanix AHV monitoring?
Yes, Site24x7 provides native monitoring for the Nutanix Acropolis Hypervisor (AHV), giving you visibility into the hypervisor's performance alongside your other virtualization platforms.
Can I monitor non-Nutanix devices in the same console?
Yes. Site24x7 is an all-in-one monitoring solution. You can monitor Nutanix HCI alongside physical servers, network devices (routers, switches), cloud platforms (AWS, Azure), and applications in a single unified dashboard.
How do I receive alerts for Nutanix issues?
Site24x7 supports intelligent alerting via email, SMS, voice calls, and third-party integrations like Slack, Microsoft Teams, and Jira. You can set custom thresholds for metrics like IOPS or latency to prevent false positives.


