Monitor Cisco Catalyst SD-WAN in Site24x7
Cisco Catalyst SD-WAN is a cloud-delivered WAN architecture designed to securely connect branches, data centers, and cloud environments. It offers centralized control, automated provisioning, and intelligent traffic steering across hybrid networks.
With Site24x7, you can monitor the health, availability, and performance of your entire SD-WAN environment—from Edge devices to orchestrators—through a unified dashboard.
Integrating Cisco Catalyst SD-WAN with Site24x7 gives you:
- Real-time visibility into device health and availability
- Alerts for outages, latency spikes, or degraded performance
- Trend analysis for resource usage and application traffic
- A unified interface to view all SD-WAN components
Common terms
- Edge: Branch-level devices that establish secure connections over MPLS, LTE, or internet. They handle routing, encryption, and application-aware forwarding.
- Controller: Performs centralized control functions and pushes optimal routing policies to Edges.
- Validator: Ensures secure onboarding of Edge devices by validating control connections within the SD-WAN fabric.
- Manager (vManage): A centralized platform for configuration, policy definition, and monitoring of the SD-WAN infrastructure.
How it works
- Site24x7 connects to the Manager and discovers Edges, Controllers, Validators, and the Manager instance through vManage API.
- Along with device status, Site24x7 displays poll metrics like Availability, Response Time, CPU and memory utilization.
- In case of any issue, Site24x7 sends alerts based on configured thresholds.
Use case
Consider an enterprise IT team managing a WAN environment that connects corporate headquarters and regional offices using Cisco Catalyst SD-WAN. The team is responsible for ensuring consistent application performance, secure connectivity, and reliable uptime across all locations.
By monitoring Cisco Catalyst SD-WAN in Site24x7, the team can centralize the monitoring of all SD-WAN components—including Edge devices, Controllers, Validators, and Managers. This allows them to:
- Detect connectivity issues between regional offices and the datacenter or headquarters, including high bandwidth usage and traffic spikes.
- Automate alerts and generate reports for SLA tracking and compliance.
- Quickly isolate and resolve performance issues with visibility into historical and real-time metrics.
This continuous monitoring approach helps IT teams maintain high performance across the WAN, minimize downtime, and support business-critical applications—regardless of where users or services are located.
Outcome: Improved operational efficiency, faster troubleshooting, and better end-user experience across a distributed enterprise network.
Prerequisites
Before setup, ensure you have the following:
- The Manager URL (Cisco vManage host)
- Valid username and password with read privileges.
All credentials are securely encrypted when stored in Site24x7.
Adding a Cisco Catalyst SD-WAN monitor
To begin monitoring, add your Cisco Catalyst SD-WANs to Site24x7.
Viewing the Cisco Catalyst SD-WAN monitor summary
- Log in to your Site24x7 account.
- Navigate to SDN > Catalyst, then click Cisco Catalyst SD-WAN.
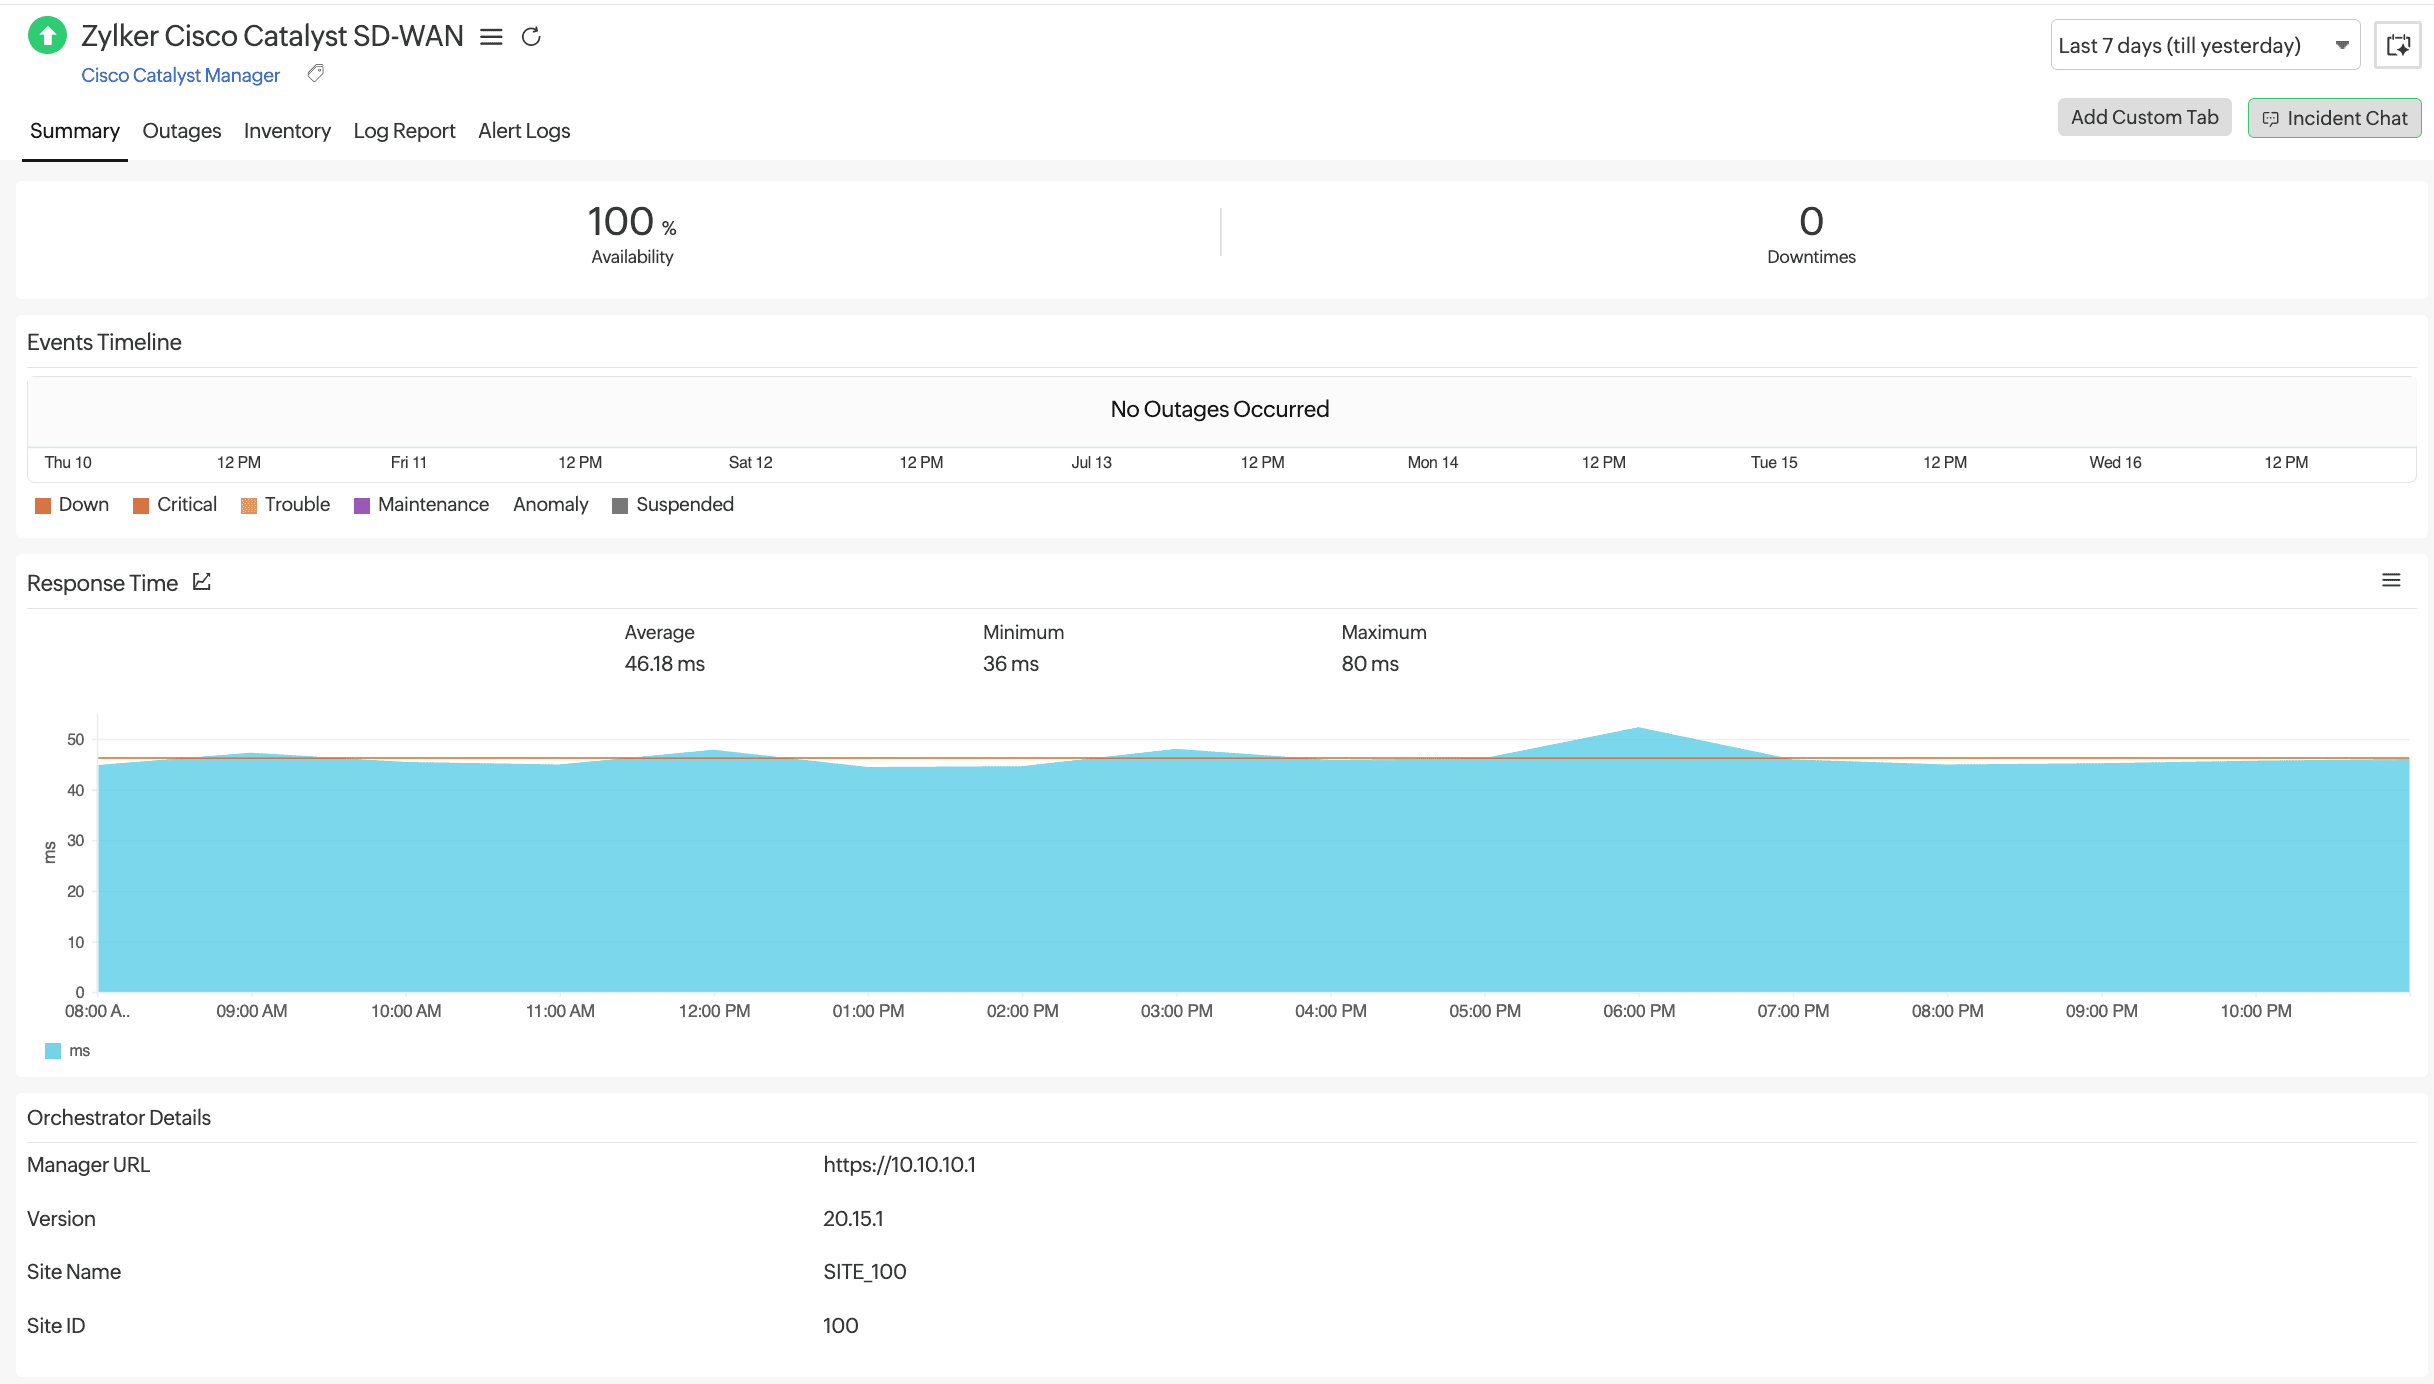
- Then, click the required monitor to view the Summary.
- Click Availability or Downtimes to view the Availability Summary Report.
- Response Time and Manager Details are also available on the page.

Viewing the summary for Validator, Controller and Edges
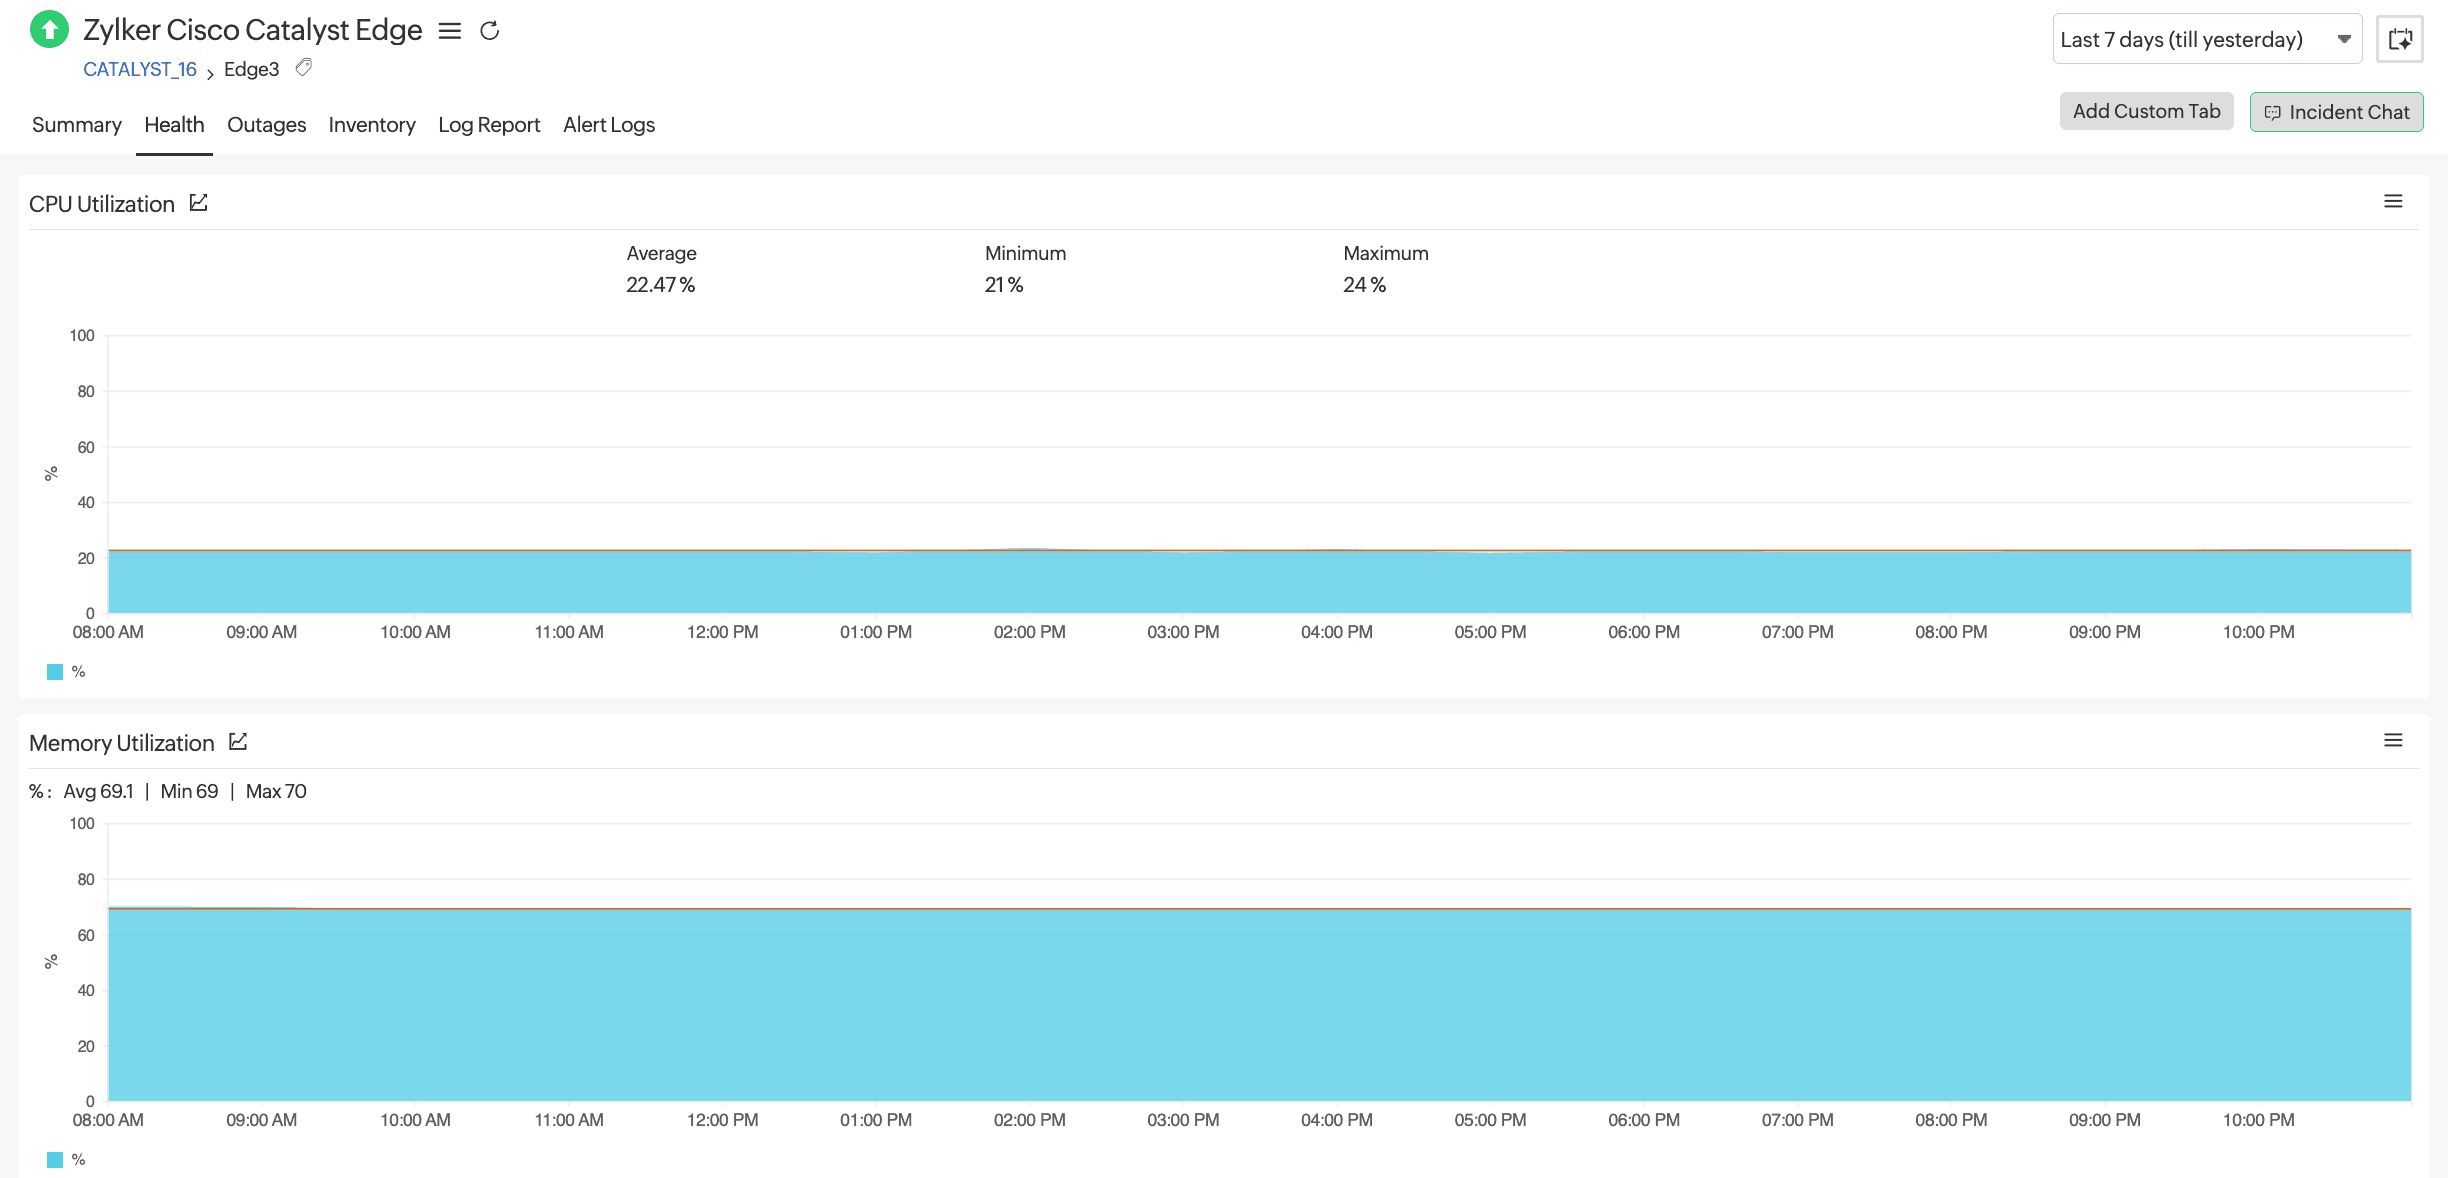
- Navigate to SDN > Catalyst, then click Validator, Controller, or Edges, as needed.
- Click the required monitor to view the Summary.
- Click Availability or Downtimes to view the Availability Summary Report.
- Navigate to the Health tab to view CPU Utilization and Memory Utilization.

Performance metrics
- Manager (vManage): Availability and Response Time
- Edge devices, Controllers, and Validators: Availability, CPU Utilization, Memory Utilization
Threshold configuration
You can define custom thresholds in Site24x7 to monitor the performance proactively and the health of your Cisco Catalyst SD-WAN components. These thresholds help trigger alerts before issues escalate. To add or edit thresholds,
- Navigate to Admin > Configuration Profile > Threshold and Availability.
- You can add or edit thresholds for Cisco Catalyst Manager, Cisco Catalyst Controller, Cisco Catalyst Validator, and Cisco Catalyst Edge. Click on an existing record to edit the threshold, or click the Add Threshold Profile button on the top-right of the table to create a new one.
- Make sure that the appropriate Monitor Type is selected.
- Next, establish threshold values for Response Time, CPU Utilization, and Memory Utilization, if applicable.
