
Top N & Bottom N Reports
View the highest and lowest values in a defined performance attribute using Top N &Bottom N Reports. The resultant data is displayed in a tabular format in descending order of the monitored parameter. The unified dashboard provides you detailed insights into the report.
How does it help you?
The Top N & Bottom N report pinpoints the performance degradation of your monitored resources. For example, a listing of the Top N websites based on response time allows you to understand how well your websites are performing. The report includes the top 10/25/50/100 websites with the longest response time (the entry appearing at the top) for a preset time period. Whereas the Bottom N report pinpoints the performance degradation of your monitored resources. It lists the bottom 10/25/50/100 websites that had the least response time during a specific time period.
Generate Top N & Bottom N Report
- Log in to Site24x7.
- Navigate to Reports > Monitor Type > Top N & Bottom N Reports.
Note
You can generate reports for all your monitor types.
- Change the listed parameters to view a customized report.
- Show: Choose top 10/25/50/100 results from the drop-down list.
- Time Period: Choose the required time period.
NoteThe user can generate Top N reports for the following time slots: Last Hour, Last 6 Hours, Last 12 Hours, Last 24 Hours, Today, Yesterday, This Week, Last Week, Last 7 Days, Last 30 Days, This Month, Last Month, and Last 3 Months.
- To generate a report, configure the required fields and filters.
- Once you have completed the configuration, click Generate to create the report.
NoteThe Generate button turns green when you modify the report configuration, indicating that the report can be generated using the updated settings.
- Once the report is generated, click "Share This" button on the top right corner.
- Publish Report : Click publish report and populate the form. This creates a permalink of the report for customers without a login.
- Email: Share the report via an email. Email can be sent only to verified users who have agreed to receive emails from Site24x7.
- Export CSV: Export the report as a CSV file.
- Export PDF: Export the report as a PDF file.
- Schedule Report : Populate the schedule report form to mail the Top N & Bottom N Report to the customer.
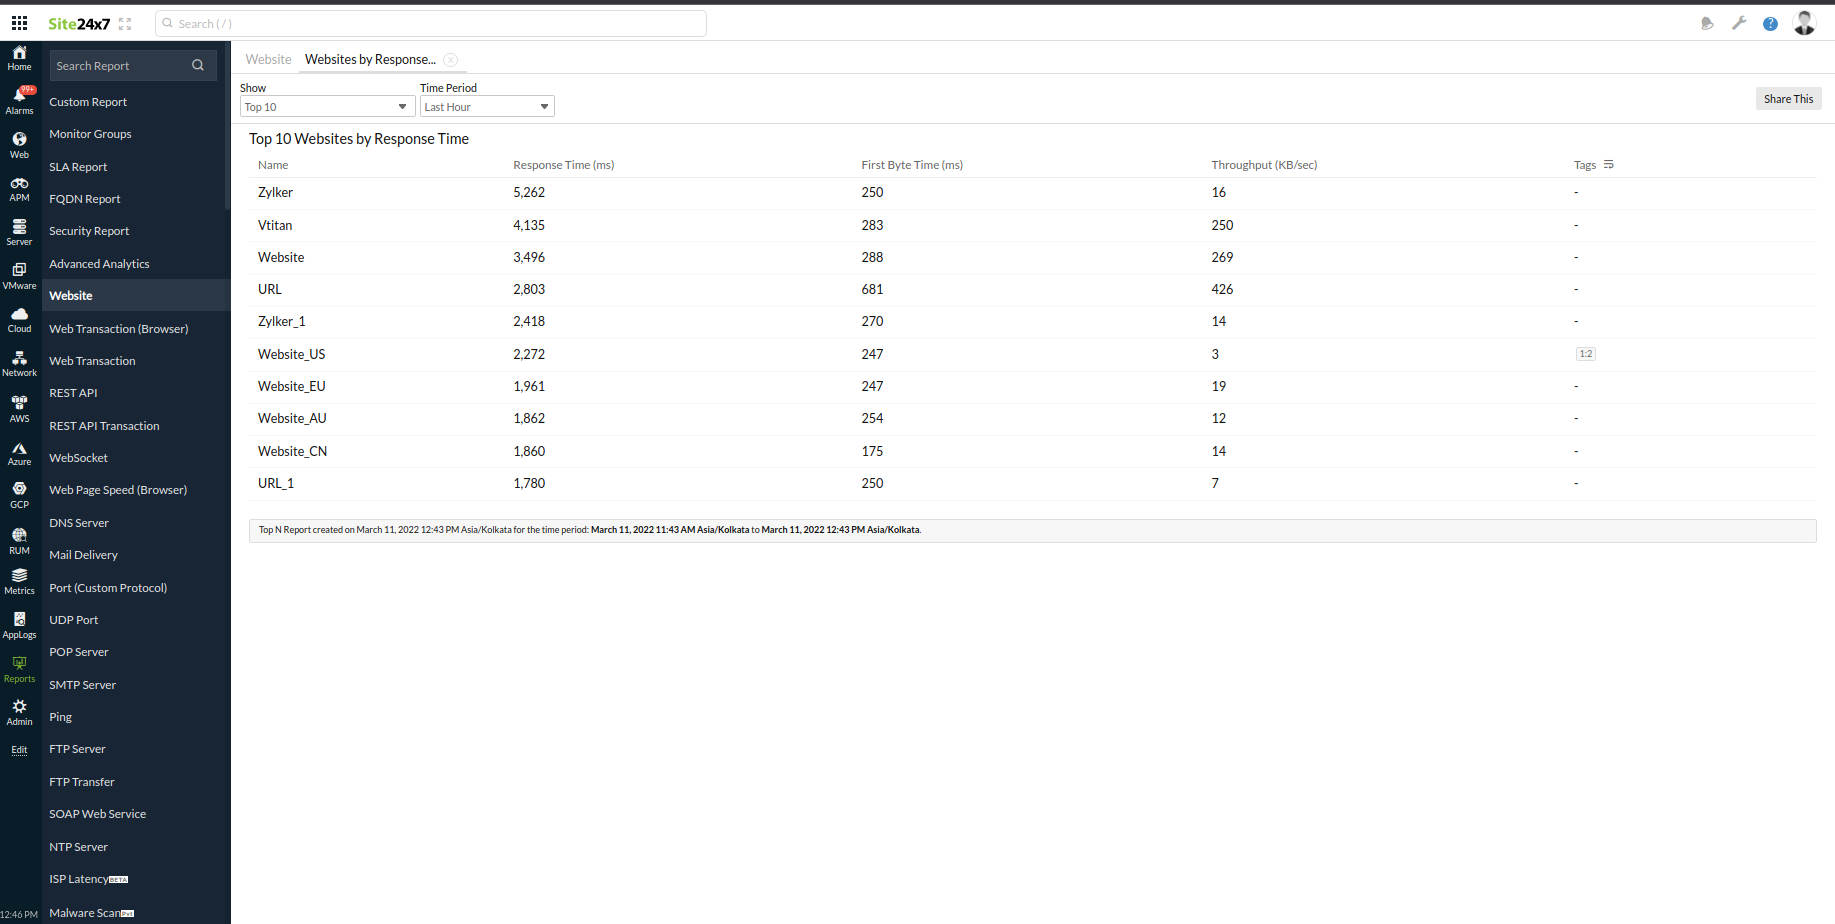
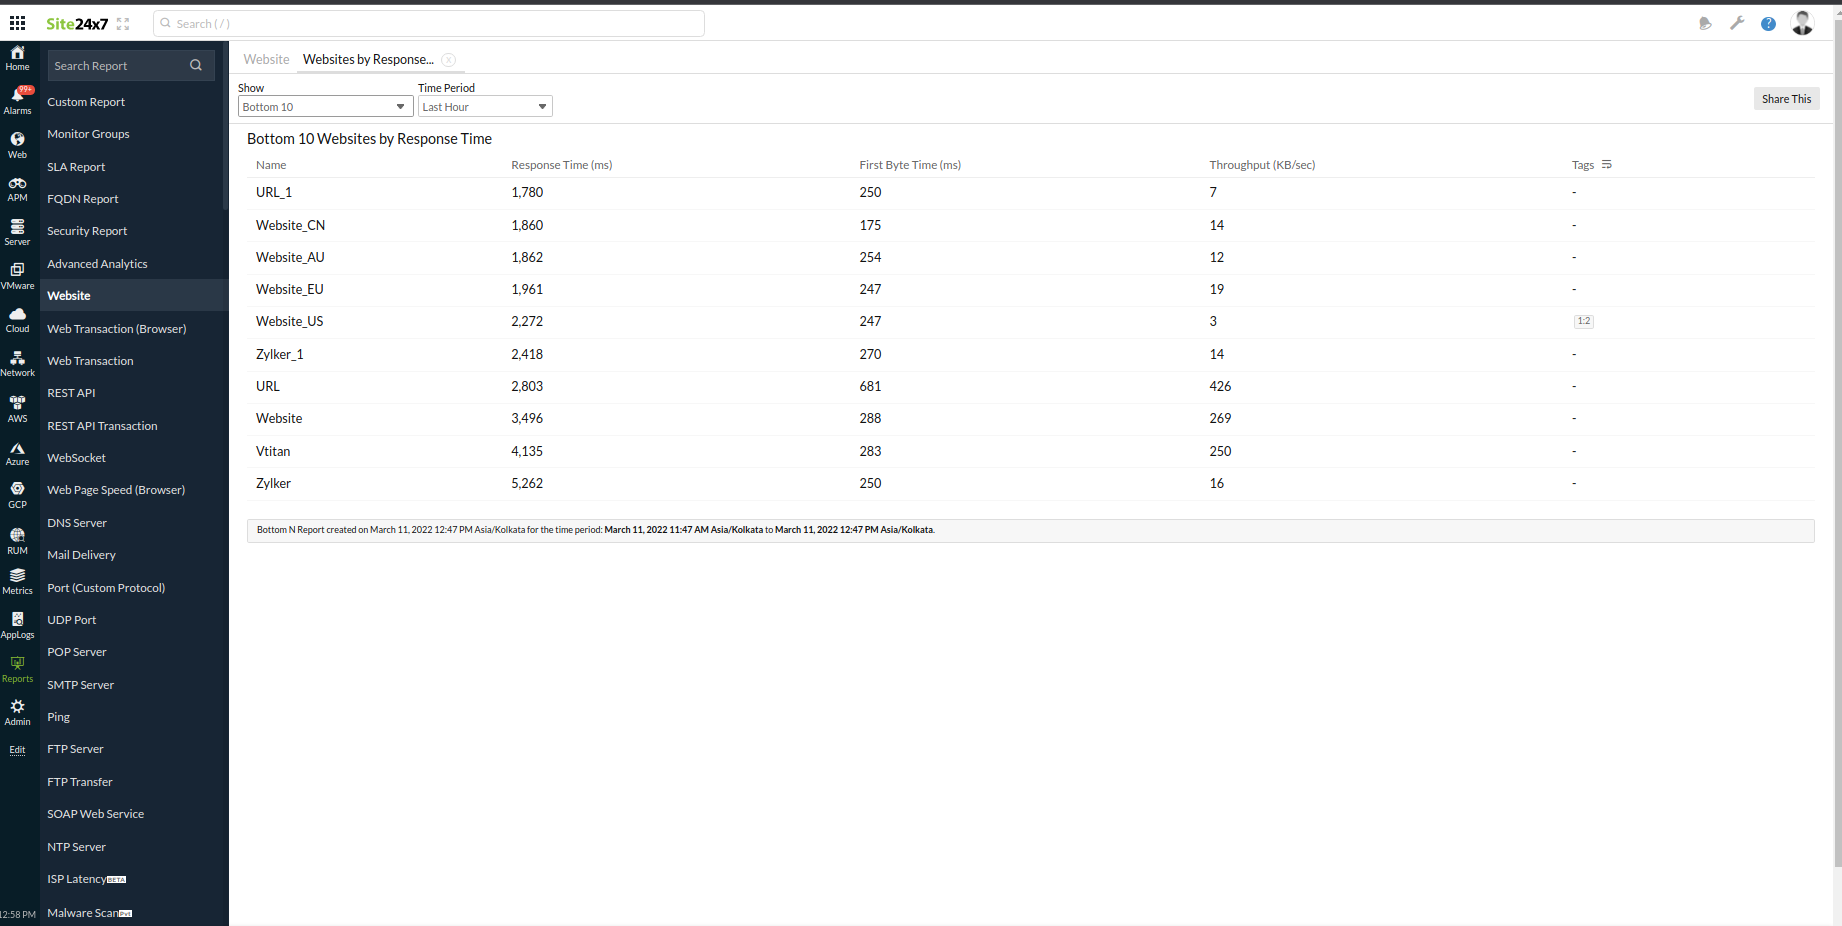
Interpret Top N & Bottom N Reports
The following table provides insight into the various parameters listed under the Top N & Bottom N reports.
Monitors |
Top N & Bottom N Metrics |
Other Metrics and Data |
| Website |
Response Time (ms) |
First Byte Time (ms), Throughput (KB/sec) |
| Website Application (Real Browser) |
Transaction Time (ms) |
Average, minimum, and maximum transaction time |
| DNS |
Response Time (ms) |
Average, minimum, and maximum response time |
| POP Service Monitor |
Response Time (ms) |
Average, minimum, and maximum response time |
| Mail Server RTT |
Response Time (ms) |
Average, minimum, and maximum response time |
| Ping Monitor |
Response Time (ms) |
Average, minimum, and maximum response time |
| FTP Service Monitor |
Response Time (ms) |
Average, minimum, and maximum response time |
| FTP RTT Monitor |
Response Time (ms) |
Average, minimum, and maximum response time |
| Web Page Analyzer |
Response Time (ms) |
Average, minimum, and maximum response time |
| Port Monitor |
Response Time (ms) |
Average, minimum, and maximum response time |
| SMTP Service Monitor |
Response Time (ms) |
Average, minimum, and maximum response time |
| REST API Monitor |
Response Time (ms) |
Average, minimum, and maximum response time |
| SOAP |
Response Time (ms) |
First Byte Time (ms), Throughput (KB/sec) |
| Web Application (Transaction Recorder) |
Transaction Time (ms) |
Throughput (KB/sec) |
| Server |
CPU Cores |
Average, minimum, and maximum percentage of CPU cores usage |
|
Memory |
Average, minimum, and maximum percentage of RAM (MB) usage |
|
|
Disk |
Average, minimum, and maximum percentage of disk (MB) usage |
|
|
Partition Used Space |
Average, minimum, and maximum percentage of partition space usage |
|
|
15 Min Load Average |
Average, minimum, and maximum percentage of 15 min load average |
|
|
Disk Busy Percentage |
Average, minimum, and maximum percentage of busy disk space |
|
|
Disk Idle Percentage |
Average, minimum, and maximum percentage of idle disk space |
|
|
Free Physical Memory |
Average, minimum, and maximum percentage of free memory space available |
|
|
Used Physical Memory |
Average, minimum, and maximum percentage of used memory space |
|
|
System Idle Percentage |
Average, minimum, and maximum percentage of system idle percentage |
|
|
Bandwidth Usage |
Average, minimum, and maximum percentage of bandwidth usage |
|
|
Process CPU Usage |
Average, minimum, and maximum percentage of process CPU usage |
|
|
Process Memory Usage |
Average, minimum, and maximum percentage of process memory usage |
|
|
Packets Sent |
Average, minimum, and maximum percentage of packets sent |
|
|
Packets Received |
Average, minimum, and maximum percentage of packets received |
|
| MS Exchange Monitor |
Page Requests fulfilled by Cache |
Average, minimum, and maximum page requests fulfilled by the cache every second |
|
DB Writes Latency (ms) |
Average, minimum, and maximum DB writes latency |
|
|
RPC Requests |
Average, minimum, and maximum RPC requests/second |
|
|
Slow QP Threads |
Shows the number of query processor threads currently running queries that are not optimized. |
|
|
MB Average delivery time |
Average of the number of messages delivered |
|
|
PF Average delivery time |
Average Delivery Time in miliseconds between the submission of a message to the mailbox store and the delivery to all local recipients |
|
|
Hub SMTP Outbound |
Shows the outbound SMTP messages in the hub |
|
|
Hub SMTP Inbound |
Shows the inbound SMTP messages in the hub |
|
|
Messages sent per second |
Messages sent per second via the SMTP protocol |
|
|
Messages received per second |
Messages recieved per second via the SMTP protocol |
|
|
Active Sync Request Per Second |
Average, minimum, and maximum active sync requests/second |
|
|
Outlook Web Access Request Per Second |
Average, minimum, and maximum outlook web access requests/second |
|
|
Delayed Calls |
Tells the number of calls delayed |
|
|
Average Call Duration |
Shows the average duration of a local delivery call |
|
| IIS |
Network Traffic |
Average, minimum, and maximum network traffic rate in KB/second |
| MS SQL |
Batch Request |
Average, minimum, and maximum batch requests per second |
|
Target Server Memory |
Average, minimum, and maximum target server memory in megabytes |
|
| EC2 Instance |
CPU Utilization |
Maximum CPU utilization of a specific EC2 instance |
|
Network in (bytes) |
Latest update on the incoming network traffic |
|
|
Network out (Bytes) |
Latest update on the outgoing network traffic |
|
|
Disk Read Operations |
Number of disk read operations per second, of the latest poll |
|
|
Disk Write Operations |
Number of disk write operations per second, of the latest poll |
|
|
CPU Credits Usage* |
Number of CPU credits used during the measurement period |
|
|
CPU Credits Balance* |
Number of unused CPU credits a T2 instance has earned |
|
| RDS |
CPU Utilization |
The total CPU utilization across the instance in percentage |
|
Free Storage |
The amount of free space left in the RDS instance |
|
|
Database Connections |
The number of database connections in use |
|
|
Disk read Operations |
Number of disk read operations per second, of the latest poll |
|
|
Disk write Operations |
Number of disk write operations per second, of the latest poll |
|
|
Byte Read from Disk |
The average number of bytes read from the disk per second |
|
|
Byte Write from Disk |
The average number of bytes written to the disk per second |
|
|
Read Latency |
The average amount of time taken per disk read operation |
|
|
Write Latency |
The average amount of time taken per disk write operation |
|
| VMware ESX/ESXi |
Memory Usage |
Average, minimum and and maximum percentage of memory (in MB) used |
|
Disk Usage |
Average, minimum, and maximum disk usage rate in Kbps |
|
|
CPU Usage |
Average, minimum, and maximum percentage of CPU usage |
|
|
Network Usage |
Average, minimum, and maximum network usage rate in Kbps |
|
| VMware VM |
Memory Usage |
Average, minimum, and maximum percentage of memory used |
|
Disk Usage |
Average, minimum, and maximum disk usage rate in Kbps |
|
|
CPU Usage |
Average, minimum, and maximum CPU usage frequency (in MHz) |
|
|
Network Usage |
Average, minimum, and maximum network usage rate in Kbps |
|
| Network |
Refer to Network Top N reports to know about reports of network monitors in detail. |
|
| APM |
Exceptions |
Shows the count of exceptions |
|
Errors |
Shows the count of errors |
|
|
Transactions by Count |
Apdex Score, Req. Count, Resp. Time (ms), Error Count, Fatal Count, Error Rate (%), CPU Time (ms) |
|
|
Transactions by Apdex |
Apdex Score, Req. Count, Resp. Time (ms), Error Count, Fatal Count, Error Rate (%), CPU Time (ms) |
|
|
Transactions by Response Time |
Apdex Score, Req. Count, Resp. Time (ms), Error Count, Fatal Count, Error Rate (%), CPU Time (ms) |
|
|
Transactions by Errors |
Apdex Score, Req. Count, Resp. Time (ms), Error Count, Fatal Count, Error Rate (%), CPU Time (ms) |
|
|
Transactions by Error Percentage |
Apdex Score, Req. Count, Resp. Time (ms), Error Count, Fatal Count, Error Rate (%), CPU Time (ms) |
|
|
Transactions by Fatal Count |
Apdex Score, Req. Count, Resp. Time (ms), Error Count, Fatal Count, Error Rate (%), CPU Time (ms) |
|
|
Transactions by CPU Time |
Apdex Score, Req. Count, Resp. Time (ms), Error Count, Fatal Count, Error Rate (%), CPU Time (ms) |
|
* Valid only for T2 instances