Availability Summary Report
Our availability summary report offers exhaustive detail into the overall availability summary, outage, and downtime of your configured monitor groups, for any chosen period of time. In a real-time business scenario, availability summary report provides a bird's-eye view of the overall availability of your configured monitors. The report tracks the following metrics in detail:
- Monitor Availability Summary
- Monitor Suspended Summary
- Availability Percentage Trend
- Downtime Report
- Overall Outage Details
- Monitor-wise Outage Details
Generate Availability Summary Report
- Navigate to Reports > Monitor Groups > Availability Summary Report.
- Select required monitor group from the header dropdown and change the listed parameters to view a customized report.
- Monitor Groups: Select the desired monitor group from the drop down list.
- Time Period: Choose the required time period.
NoteYou can generate reports for time periods ranging from last 1, 6, 12, 24 hours, today or upto a year back. Furthermore, you can also obtain reports for custom time periods.
- Business Hours: Select the time period that is most critical to your business.
- Maintenance time for uptime calculation: You can include / exclude maintenance time from the monitor group's uptime calculation.
- Include Subgroups: Enable this option to include subgroups of the selected Monitor Groups. Otherwise, only the selected Group will be considered.
- Once the report is generated, click "Share This" button on the top right corner.
- Publish Report: Click publish report and populate the form. This creates a permalink that would make the report accessible to customers without a login.
- Email: Share the report via an email. Email can be sent to only those verified users who have agreed to receive emails from Site24x7.
- Export CSV: Export the report as a CSV file.
- Export PDF: Export the report as a PDF file.
- Schedule Report: Populate the schedule report form, to create a report task that would trigger availability summary report mails to the customer.
Interpret Availability Summary Report
Availability Summary Report for your monitor group is displayed in a lucid format. The top band provides insight into the cumulative availability percentage, Total outage duration and the outages count of the selected monitor group, for the chosen time period.

Monitor Availability Summary
Detailed summary of downtime/uptime is presented in a tabular format. The detailed parameters are described here. To know more about all the variables and calculations, read this article.
- Total Downtime: It is the cumulative sum of outages encountered by individual monitors in your monitor group during a specified time range. Outages are expressed in terms of percentage or time.
- Total Uptime: It is the average availability of all monitors in your monitor group (sum of individual uptime divided by total number of monitors). The monitor group's cumulative uptime for the selected time period is depicted in terms of percentage or time.
- Mean Time to Repair (MTTR) - The average time to repair a device or a system back to acceptable operating conditions. The term can also mean, the time spent to restore a machine to operating condition after failure. This must be as low as possible.
- Mean Time between Failures (MTBF) - The average time that a device or a system worked without failure. The term can also mean the length of time a user may reasonably expect a device or system to work before an incapacitating fault occurs. This must be as high as possible.

Monitor Suspended Summary
Unavoidable monitor suspensions and pre-planned scheduled maintenance activities consume a chunk of downtime activity. This data is segregated from downtime and presented in a tabular format for better clarity.
- Total Suspended Time: Any downtime captured due to unscheduled suspension of the monitors in the group.
- Total Suspended Time Percentage: The cumulative downtime percentage due to the unscheduled suspension of your monitors in the group.
- Total Scheduled Maintenance: It is the cumulative sum of individual monitor's maintenance time during the reporting period.
- Total Scheduled Maintenance Percentage: The total percentage of cumulative scheduled maintenance activity carried out during the specified monitoring period.
Availability Percentage Trend
The availability percentage trend graph for the configured monitor group plots the actual availability, downtime and the overall maintenance activity against a specified time period. You can also view actual availability, downtime and marked maintenance percentage for a specified time by hovering the cursor over the designated area in the graph.

To drill down and measure the availability trend for a defined period, click and drag the cursor within the specified time slot on the graph. Click Reset Zoom on the top right corner of the graph to draw back to the default view.

Availability trend graphs have colored check boxes acting as legends for each parameter. These legends help you to visualize the groups inside the chart. Furthermore, the legends act as quick filters and enable you to isolate the parameters in the graph based on your requirement.
Downtime Report
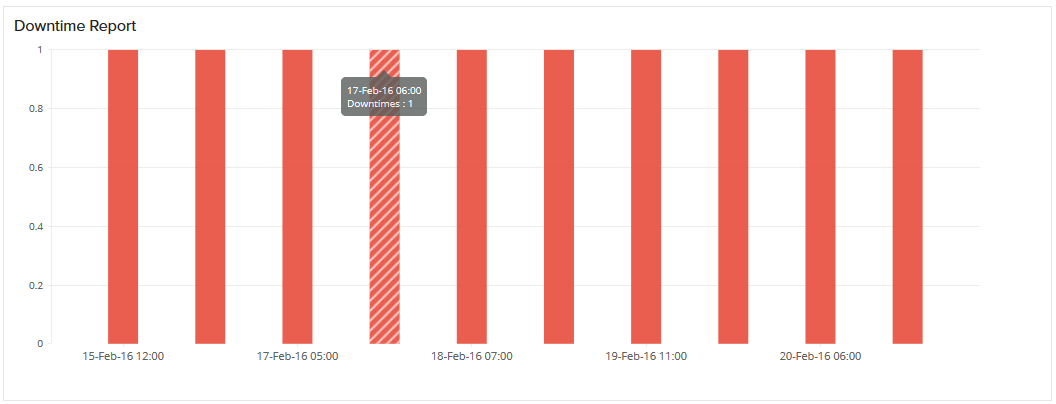
Downtime graph is mapped by counting the number of down times and plotting it against a selected time period. If the selected time period is within 24 hours, hour wise data will be plotted against X-axis. If the selected time range is outside 24 hours period, day wise data will be depicted against the X-axis.

Overall Outage Details
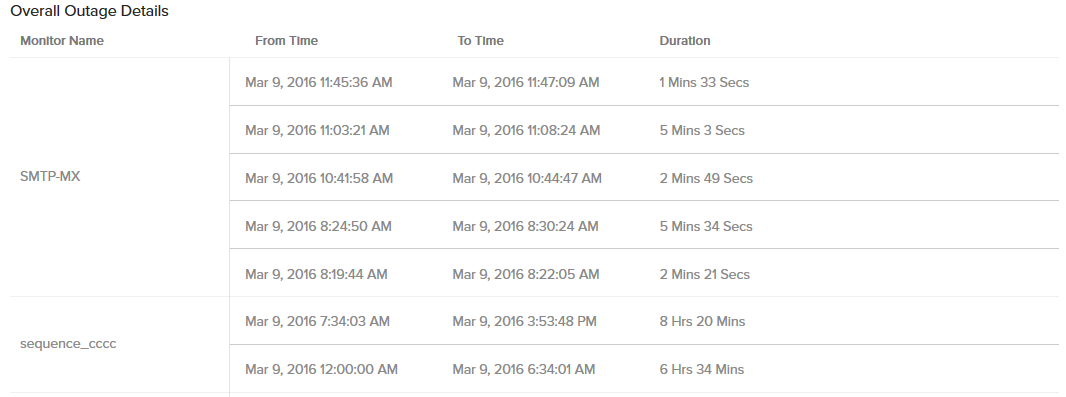
Monitors Outage Details provide a detailed interpretation of the outages incurred by all the monitors. The user gets to know the exact time frame and duration of outage.

Monitor-wise Outage Details
All the configured monitors under the monitor group are listed in a tabular layout and detailed insights into their Availability percentage, Downtime Duration and Downtime counts are provided to the end user.

