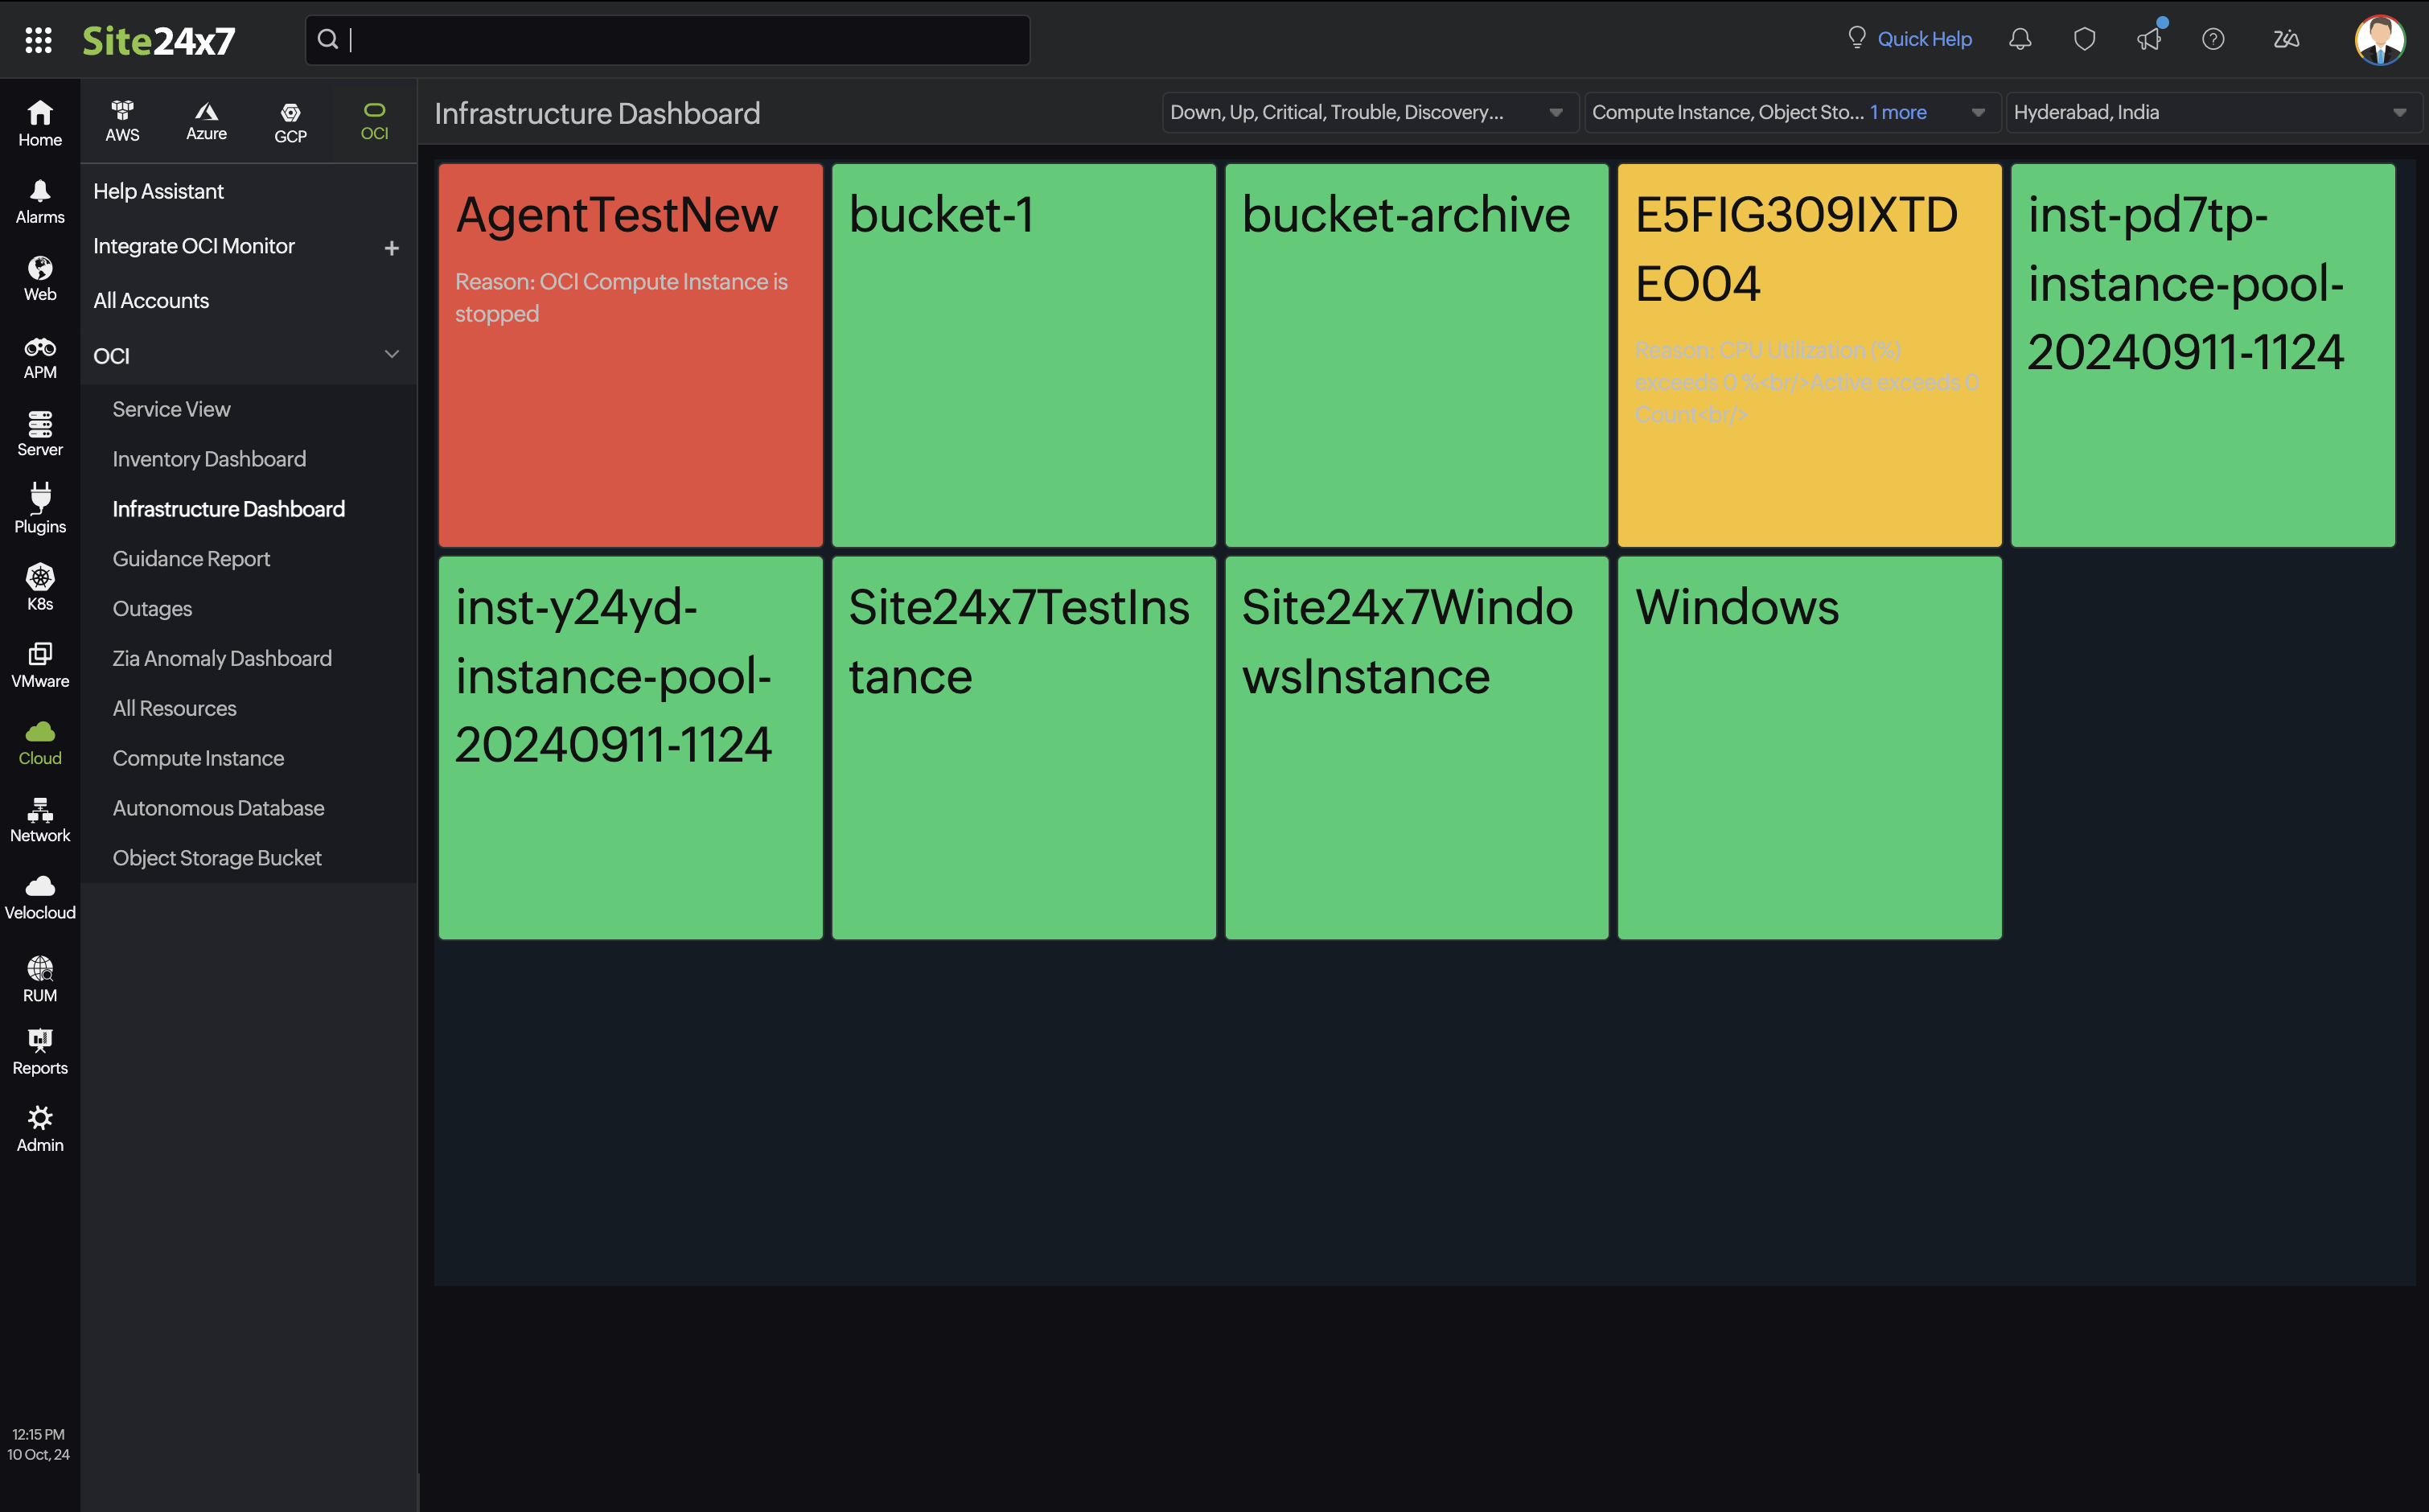
OCI Infrastructure Dashboard
Site24x7's Infrastructure Dashboard for OCI monitoring provides an NOC-style view, providing a high-level summary of the health and performance of all monitored cloud resources within your OCI platform. The dashboard consolidates data of each OCI service that supports your application in the cloud and presents critical performance insights in one central location.
Overview
Once you've successfully added an OCI monitor, you'll be directed to the Infrastructure Dashboard. You can also access it by going to OCI > Infrastructure Dashboard. Each resource box displays the monitored individual instances as color-coded tiles in this dashboard.

Data sources
The health status of a resource tile is based on data from several sources:
- Performance metrics from the OCI integration and the values of various parameters compared to set thresholds over a specific time period.
- OS and application metrics provided by the server agent running on your Compute Instance hosts, along with any threshold violations for supported metrics.
- Results from Compute Instance and system status checks.
- User actions, such as manually stopping an instance.
Dashboard UI behavior
When a threshold violation occurs, the corresponding resource tile will blink to indicate a status change, accompanied by a sound alert, and the tile's color will change accordingly.
Hover over any color-coded tile to see more details about the resource, such as its Name, Region, Status, and Type. If a resource becomes critical, changing from Up to Trouble, Critical, or Down, you can hover over the tile to quickly find out the specifics of the threshold violation.
Clicking on the resource tile will take you to its respective page, where you can access more detailed performance data.
Filters
You can customize the infrastructure view by applying filters for service, region, and monitor status. For example, if your Cloud Ops team focuses on specific geographic areas, you can use the region filter to show only OCI resources in a particular region. You can also combine filters, such as selecting a specific service and region together, to organize the monitored OCI resources in a way that suits the NOC or Operations teams.
- Filter by service: Use the drop-down to select a service, allowing you to group and display monitors based on the services to which they belong.
- Filter by region: Select a region from the drop-down to group and display monitors associated with that specific geographic area.
- Filter by monitor status: Choose a monitor status to display resources based on their status, such as Up, Down, or Critical.
Best practices
For a more comprehensive and powerful infrastructure dashboard, Site24x7 recommends using the following additional features along with its native integration:
- Agent-based monitoring: Deploy an agent on your Compute Instance to track OS-level metrics, process data, and track custom metrics from various open-source applications running on the instance.
- Threshold profiles: When creating and attaching a threshold profile to a monitored OCI resource, it's advised to set multiple alert conditions and configure advanced alerting strategies for each supported performance metric.
Related topics
-
On this page
- Overview
- Data sources
- Dashboard UI behavior
- Filters
- Best practices
