Use Cases for Tabular Performance Counters
What are tabular performance counters?
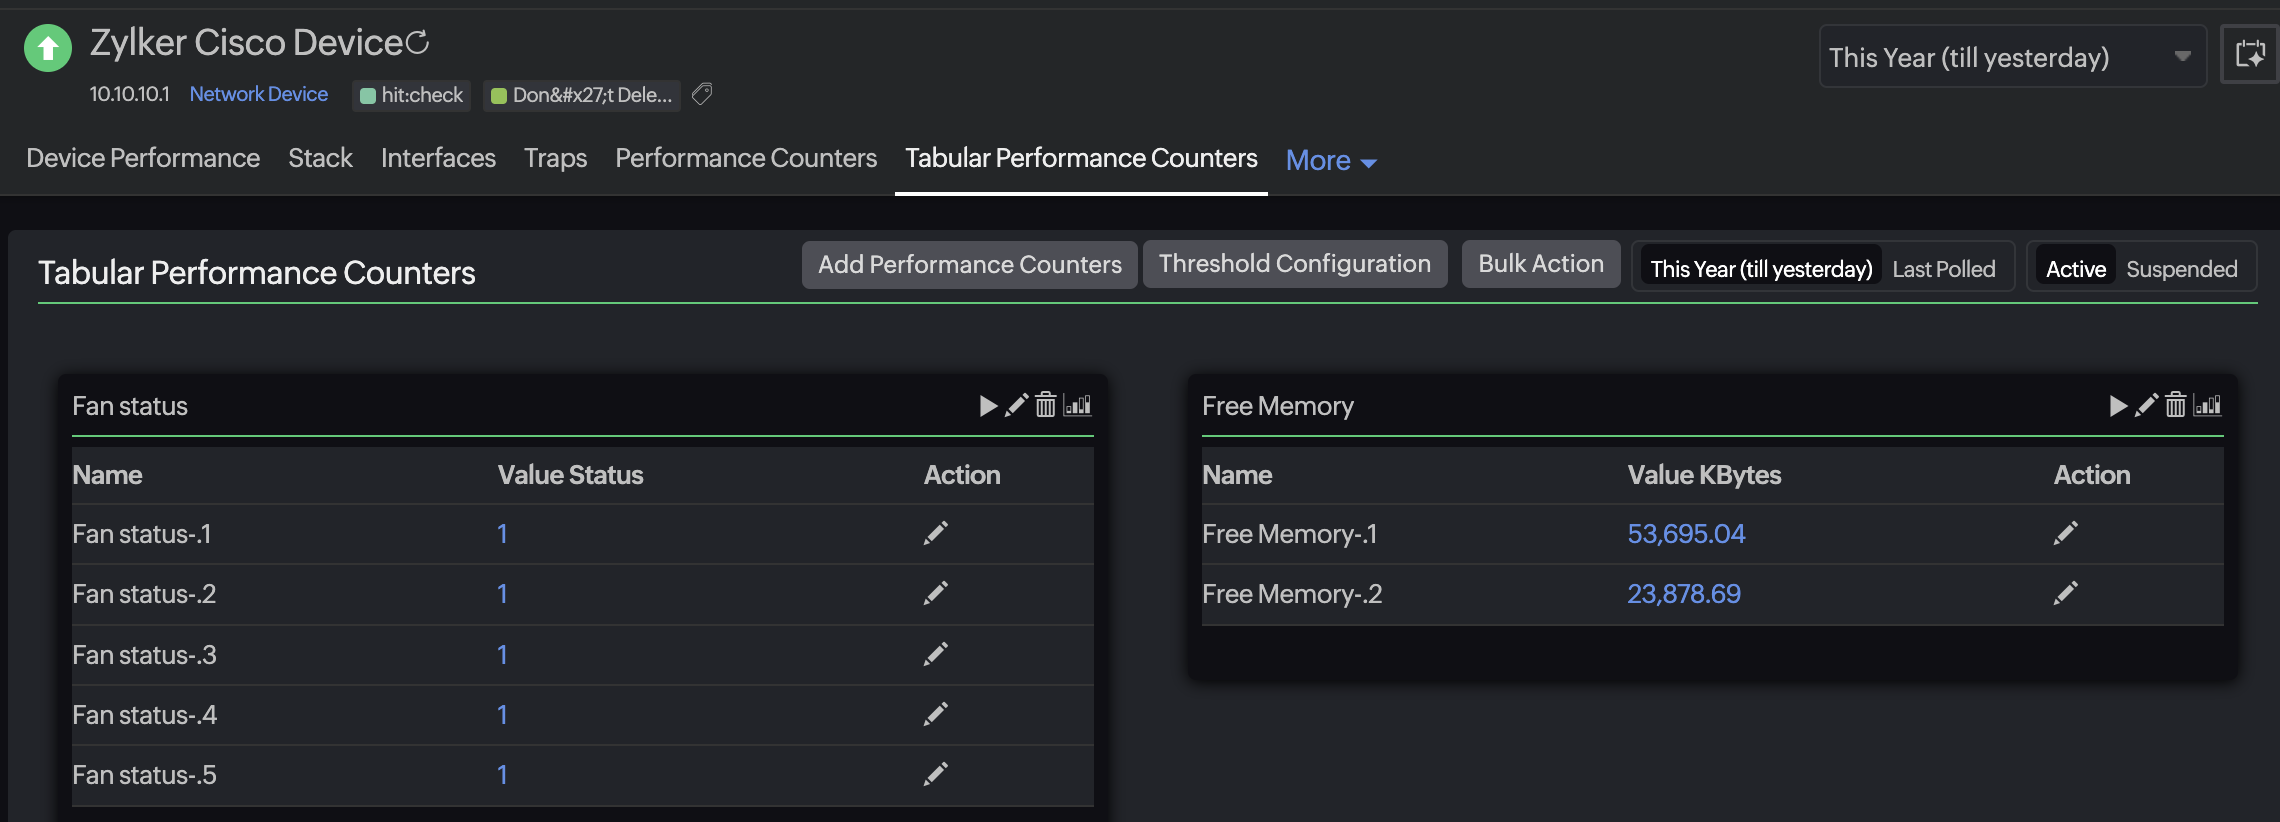
Tabular performance counters list the performance attributes of tabular OIDs. Tabular OIDs are useful when you have multiple instances of the same attribute (such as in the memory, disk, or interfaces) in a single network device.
Where can I use tabular performance counters?
Use case 1:
As a network admin, you want to monitor the In Octets of all the interfaces in your network device. To monitor tabular objects, you need to add the individual performance attributes for multiple instances under multiple interfaces. But doing this manually is time-consuming and error-prone. When you use tabular performance counters, all instances of a tabular object are added automatically once you've added a single tabular OID. For example, after you've added the tabular OID of In Octets, the In Octets of all interfaces will be displayed in the table.
Use case 2:
A network admin wants to monitor all the attributes related to temperature. Separately monitoring the attributes such as Power Supply Unit temperature, Intake Left temperature, Intake Right temperature, Exhaust Left temperature, Exhaust Right temperature, and CPU temperature, along with other temperature attributes of a Cisco switch, would be tedious. On the other hand, tabular performance counters list all these attributes in a unified view.

