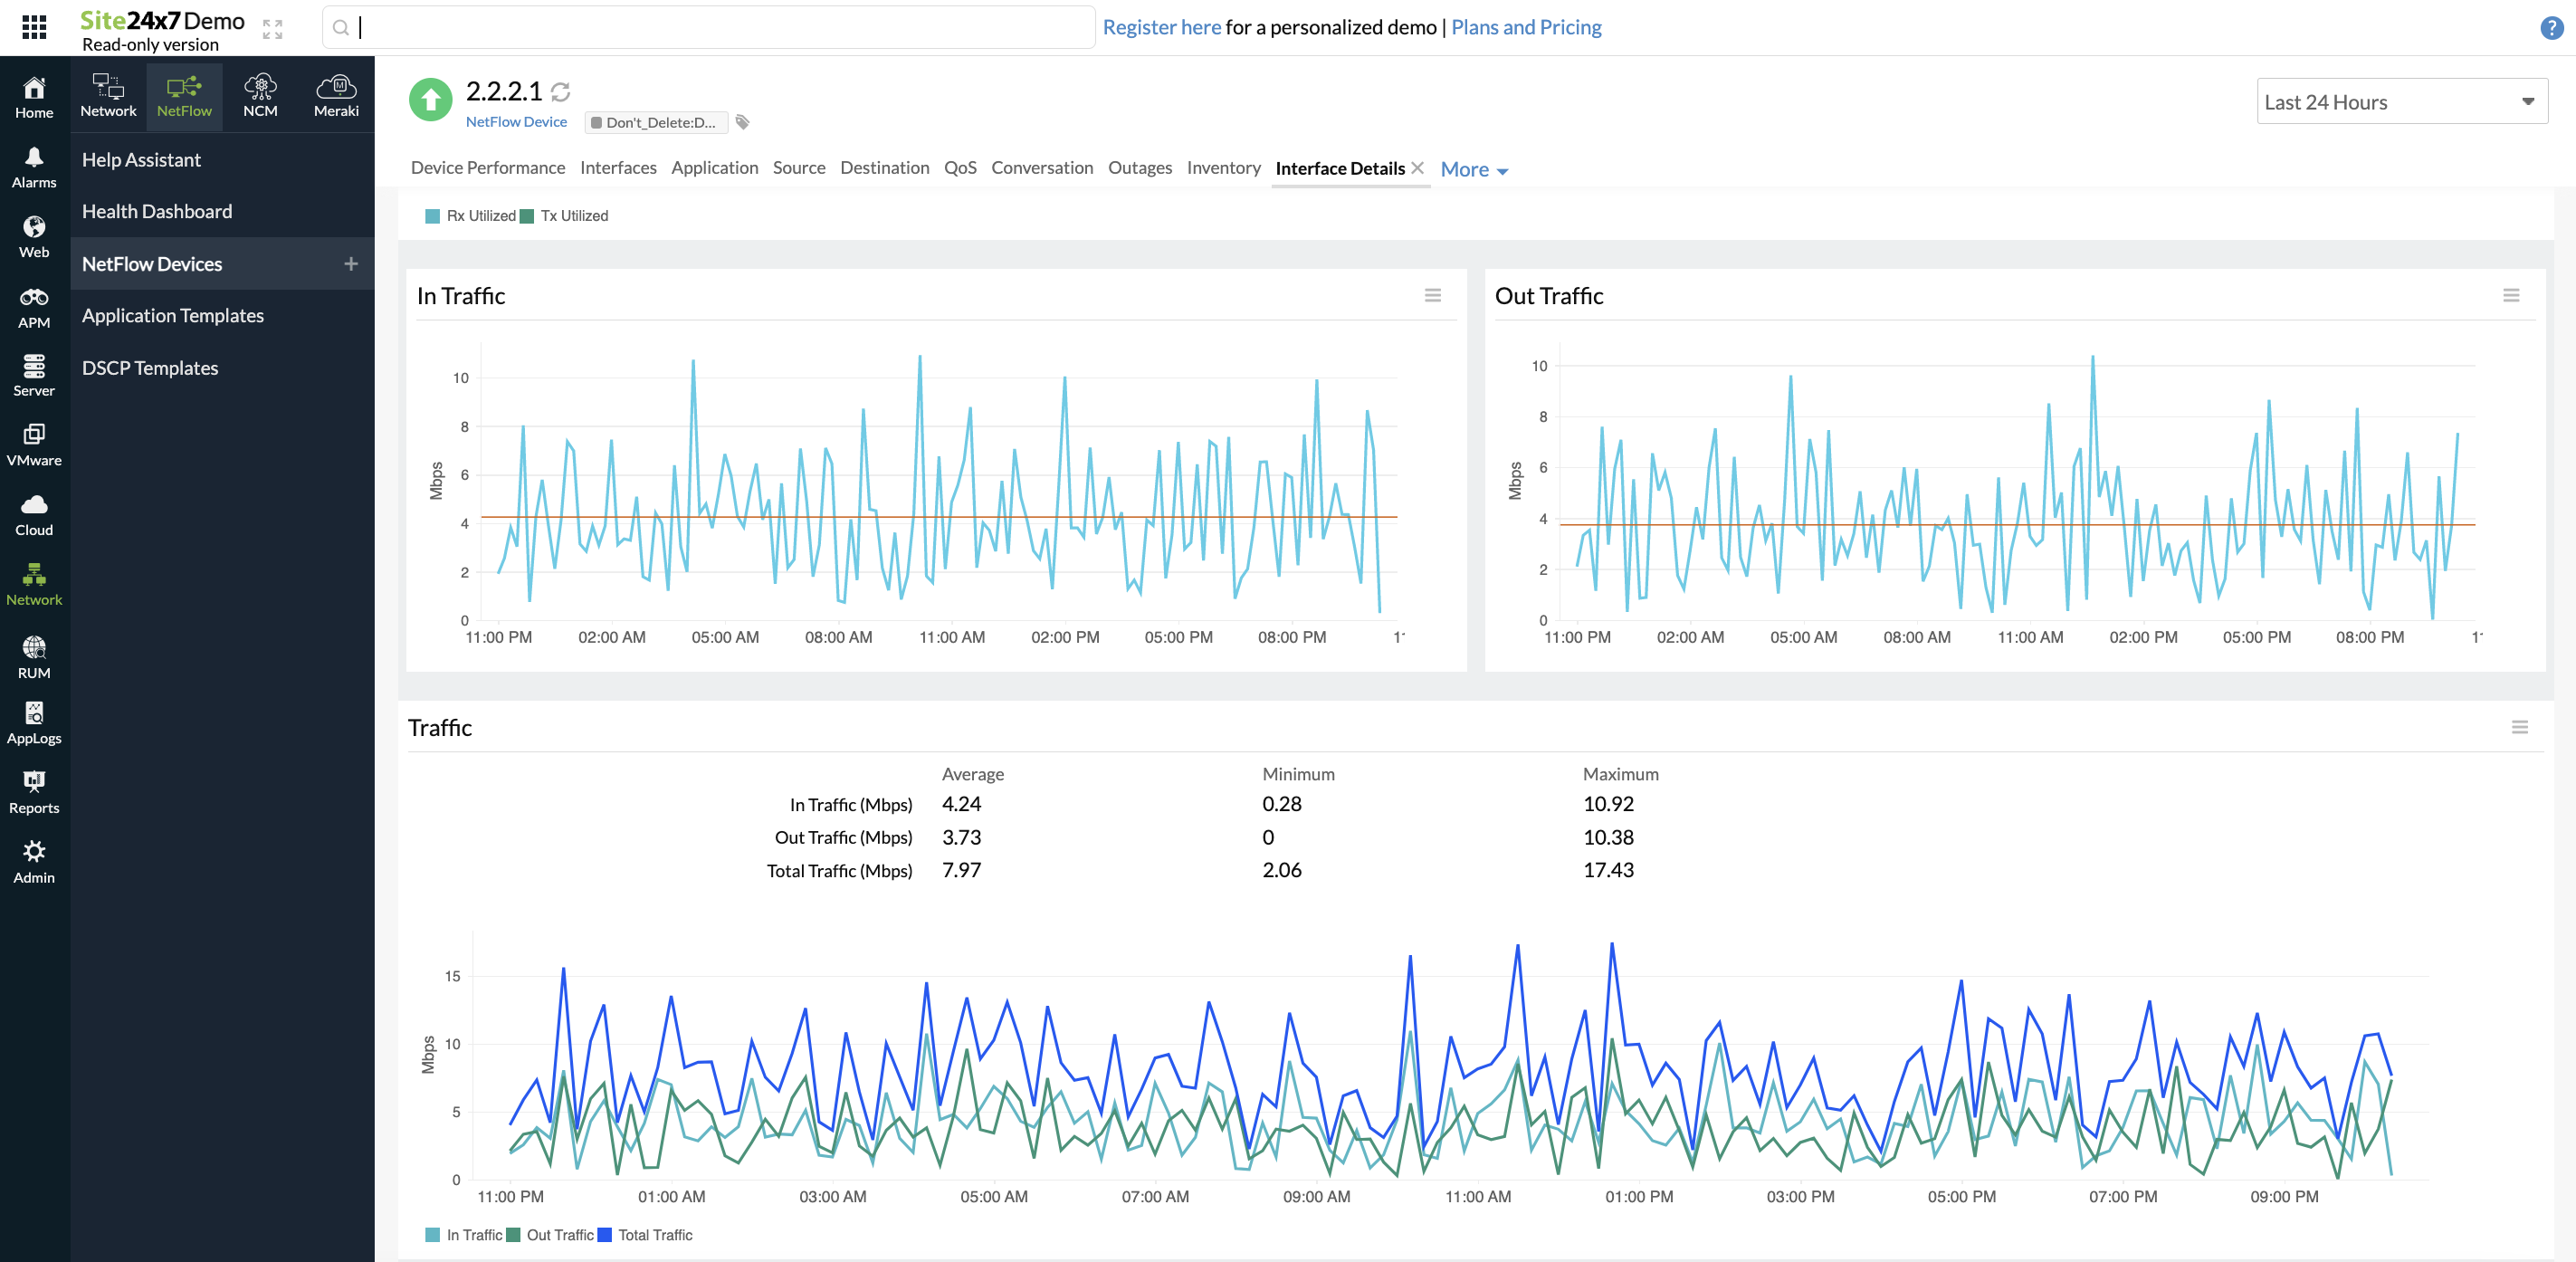
NetFlow: Interface Metrics
Understanding the flow across each interface will provide granular insights to help analyze network traffic. The metrics on both the source and destination interfaces should be closely monitored so network admins can easily point to the single point of an issue. Admins can also set thresholds and receive alerts when any of these metrics are breached.
By clicking an interface name, you can view the interface details at a granular level based on traffic, application, source, destination, or conversation.
Interface traffic metrics
Status details
View the interface name, index, status, and in and out speed for every interface.
| Metric | Description |
|---|---|
| Rx Utilized (%) | The percentage of received traffic utilized by the interface. |
| Tx Utilized (%) | The percentage of transmitted traffic utilized by the interface. |
| In Traffic (Mbps) | The amount of traffic that came through the interface in one second. |
| Out Traffic (Mbps) | The amount of traffic that went out of the interface over a given period. |
| Total Traffic (Mbps) | The total amount of traffic passing through the interface over a given period. |
| In Packets (Count) | The number of packets received by the interface. |
| Out Packets (Count) | The number of packets transmitted by the interface. |
| Total Packets (Count) | The number of packets passing through the interface. |
| Rx Volume (MB) | The total amount of traffic received by the interface. |
| Tx Volume (MB) | The total amount of traffic transmitted by the interface. |
| Total Volume (MB) | The total amount of traffic passing through the interface. |

Figure 1. NetFlow Interface Traffic metrics.
IN and OUT traffic
You can view the IN-OUT toggle button in the Application, Source, Destination, and Conversation tabs. Toggle to IN to view the details below based on In Traffic. Toggle to OUT to view the details below based on Out Traffic.
Application
Go to the Application tab to view the top N applications that passed through the interface, along with the traffic that the particular application generated.
Source
The Source tab displays the IP addresses of the devices that have generated traffic, and the amount of traffic that has been received from the particular IP address.
Destination
The Destination tab displays the IP addresses of the interfaces that have received traffic, and the amount of traffic that has been sent to the particular IP address.
Conversation
Conversation is the transfer of data from a source to a destination. This tab displays the following details:
| Metric | Description |
|---|---|
| Source | The IP address of the device that generates traffic. |
| Destination | The IP address of the device that receives traffic. |
| Application Name | The application involved in that particular conversation, i.e, the application transferred from the source to the destination. |
| Protocol | The protocol involved in the particular conversation. |
| Port | The port through which the conversation has happened. |
| DSCP | Shows the Differentiated Services Code Point (DSCP) template name associated with this conversation. |
| Traffic | The amount of traffic generated by this particular application, in this particular conversation. |
