Data Lake
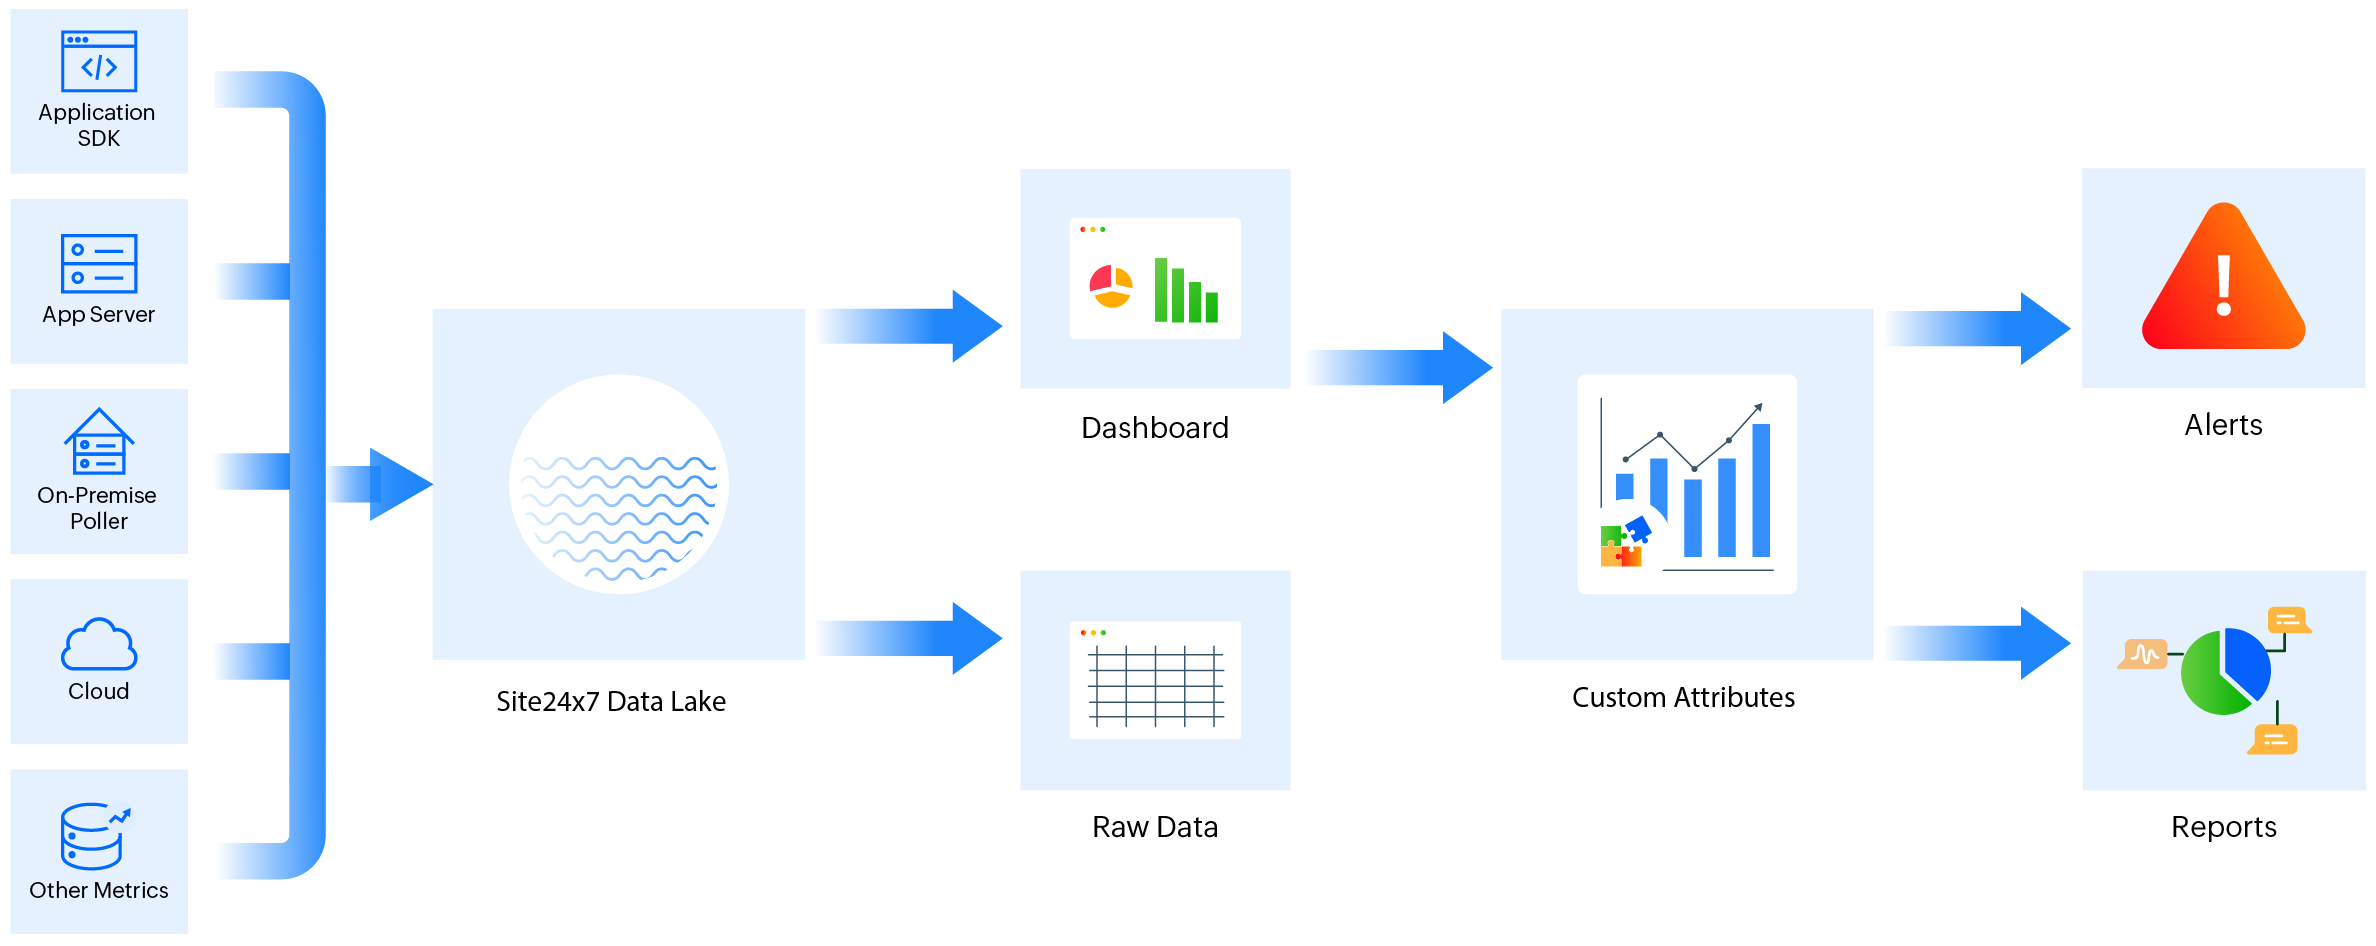
A data lake serves as a central storage repository where you can securely store extensive amounts of structured and unstructured data on a large scale. This data is typically stored in its raw, original format and can be used for various data analytics and processing purposes. It's often used for big data analytics, machine learning, data mining, and more.
Site24x7's Data Lake feature supports the creation of Custom Metrics monitors, allowing data to be pushed through API or SDK.
Use case
Consider an e-commerce platform where critical user journey metrics like product searches, shopping cart activity, check-in, and checkout processing can be stored. Customized dashboards can be created to visualize these metrics through charts, graphs, and tables, aiding in the identification of performance trends and bottlenecks. Furthermore, with the Custom Attributes feature, custom alerts and notifications can also be configured to proactively address issues, such as high cart abandonment rates or slow payment processing, ensuring a seamless shopping experience.
Benefits of a data lake
The Site24x7 Data Lake feature enables you to define and track metrics that are specific to your application and its unique requirements.
- Tailored monitoring: You can track any application-specific metric in addition to what Site24x7 provides by default.
- Granular visibility: You can monitor specific parts of your application's code, third-party integrations, or other components that are particularly important to your application.
- Customized dashboard: You can create your own dashboard that includes various visualization options like numeric charts, graphs, and tables to generate illustrations that help you understand the metrics.
- Alerting and notifications: You can set up custom alerts and notifications based on these metrics.
- Flexibility: You can adapt and create new custom metrics to monitor different aspects of your application that become important over time.
Data Lake configuration and setup
- Add a Data Lake monitor.
- The created monitor will appear in the Data Lake dashboard.
- Click on the monitor to view performance metrics.
- Create a Custom Attributes monitor for certain key metrics of a data lake monitor for which you need alerts.
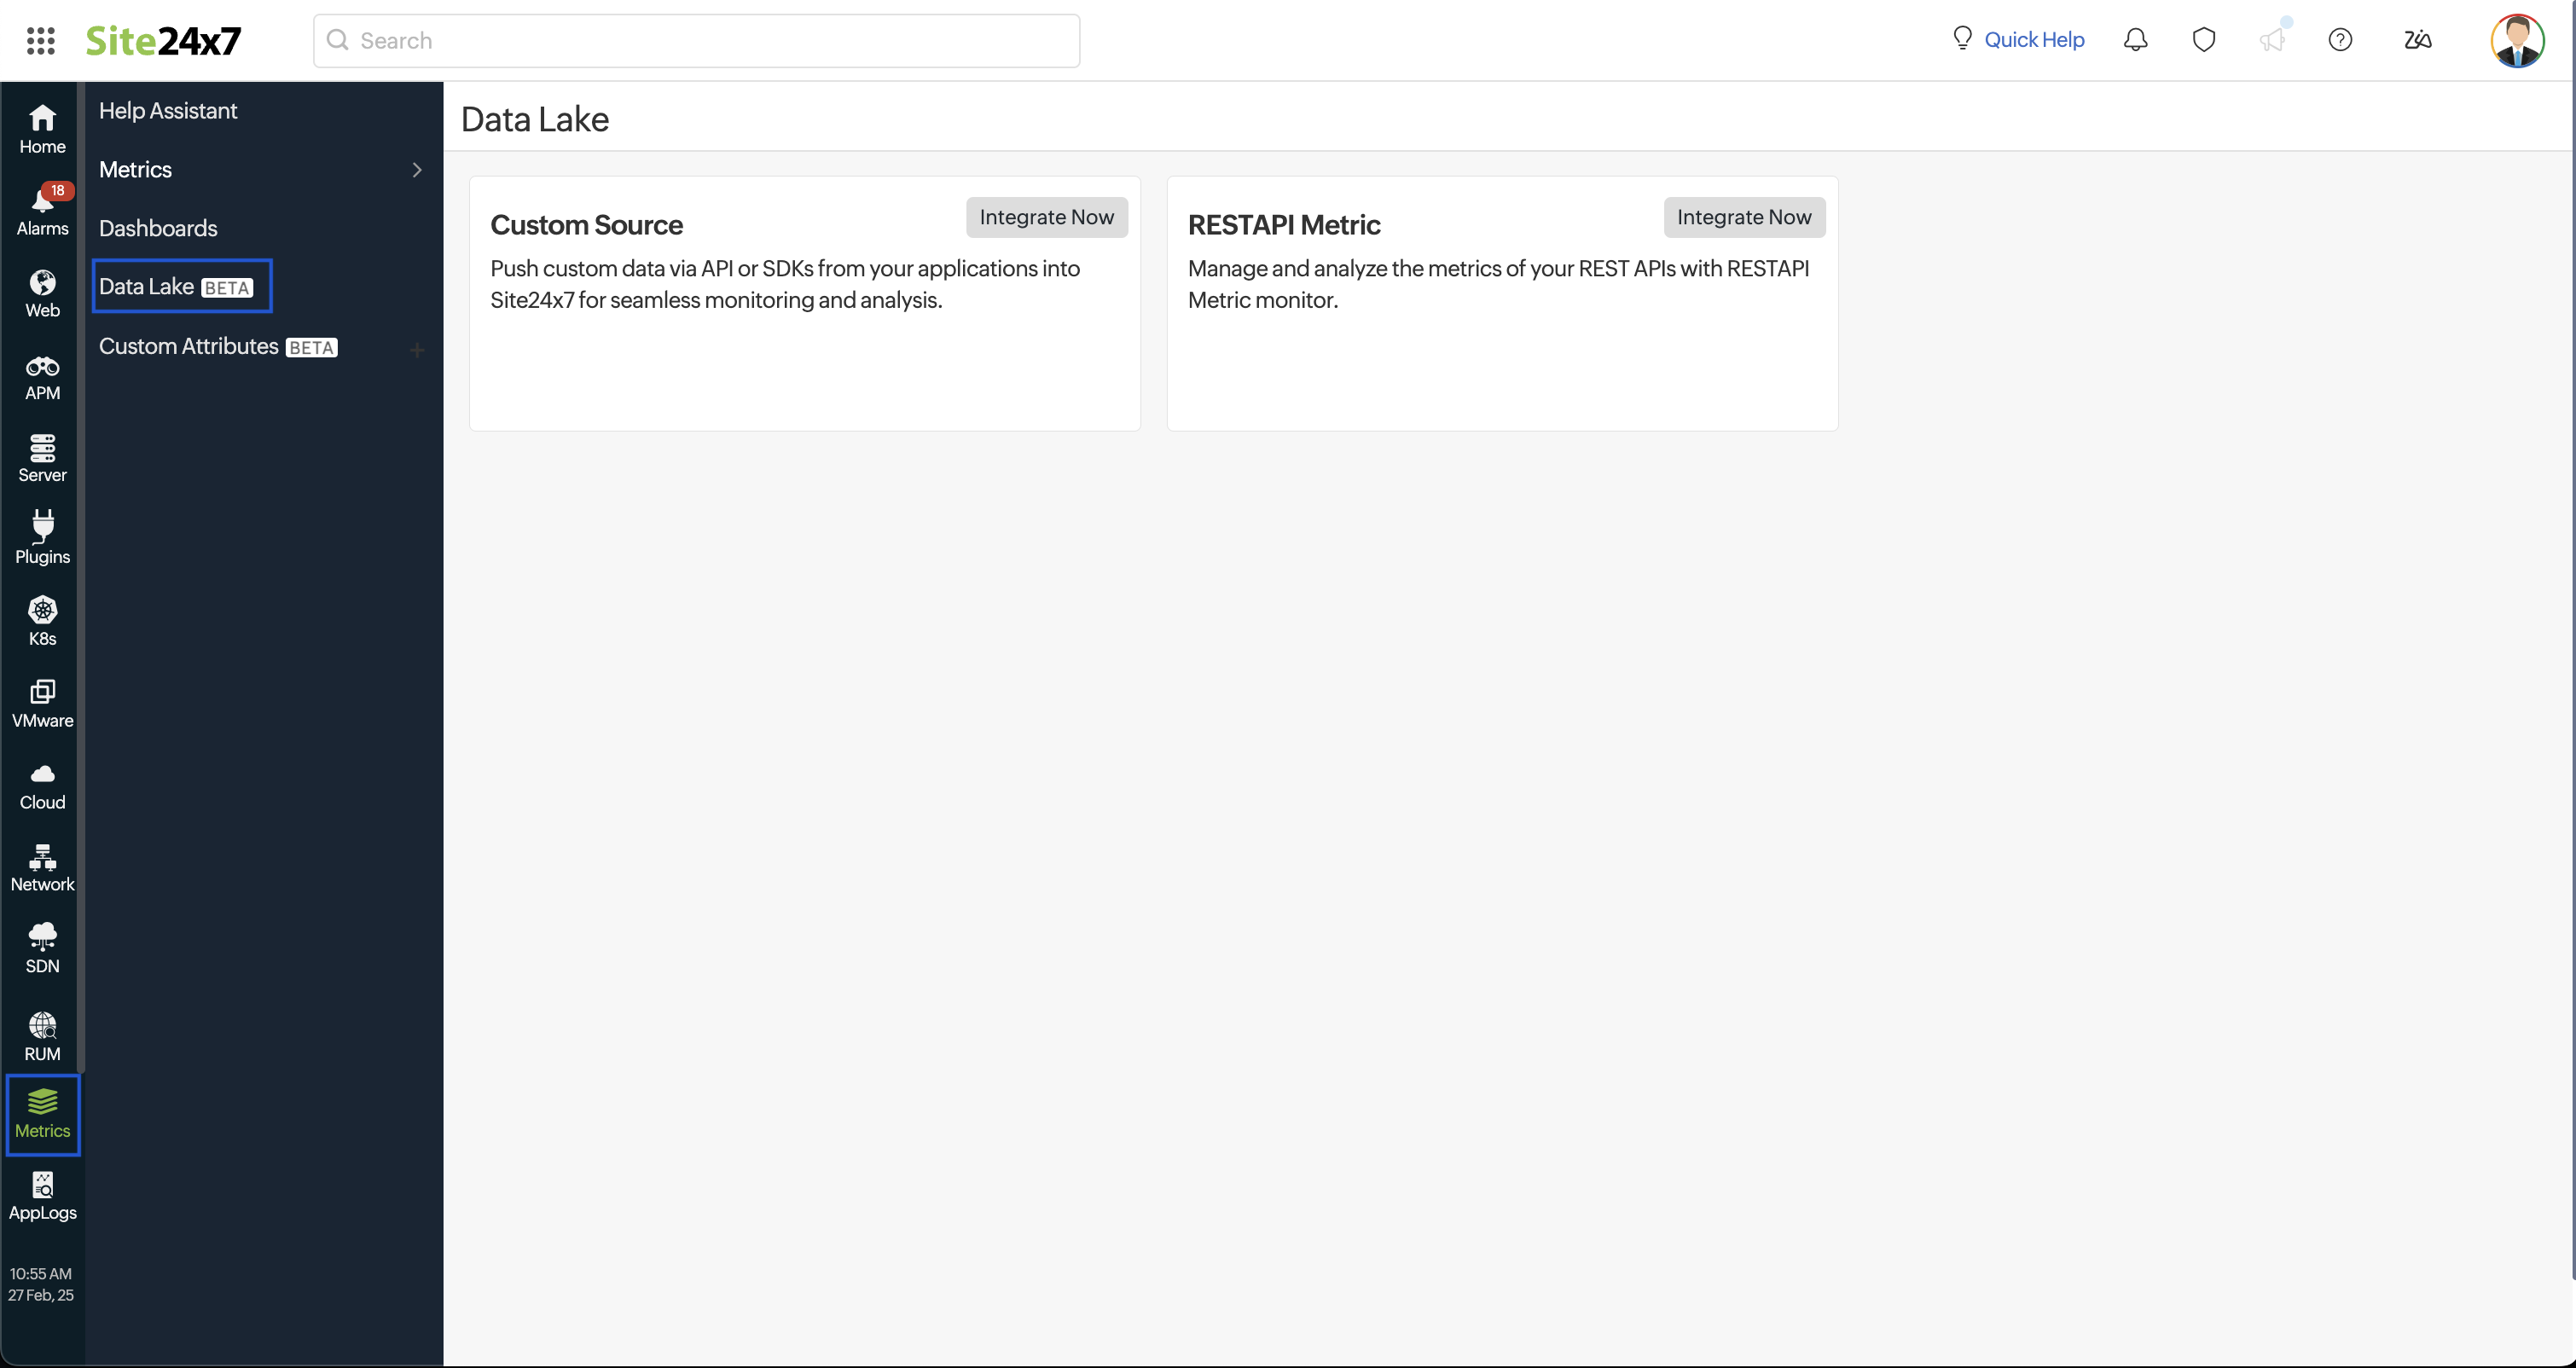
Add Data Lake monitor
To add a Data Lake monitor, follow the steps below:
- Log in to the Site24x7 web client.
- Navigate to Metrics, then Data Lake.
NoteIf you already have monitors set up, you will be redirected to the Dashboard screen, where you can find the list of available monitors.
- Choose a data integration method to push data into Site24x7:
- Custom Source: Use APIs or SDKs to send custom data.
- RESTAPI Metric: Monitor and analyze REST API metrics.