Cerberus FTP Logs
Cerberus FTP Server is a Windows-based FTP server with support for encrypted FTP sessions via FTPS and SFTP. Cerberus FTP logs offer comprehensive logging of all files and user operations. Site24x7 AppLogs natively supports Cerberus FTP logs.
Getting started
1. Log in to your Site24x7 account.
2. Download and install the Site24x7 Server Monitoring agent (Windows | Linux).
3. Go to Admin > AppLogs > Log Profile and select Add Log Profile.
4. Enter the Profile Name.
5. For Choose the Log Type, select Cerberus FTP Logs from the drop-down list.
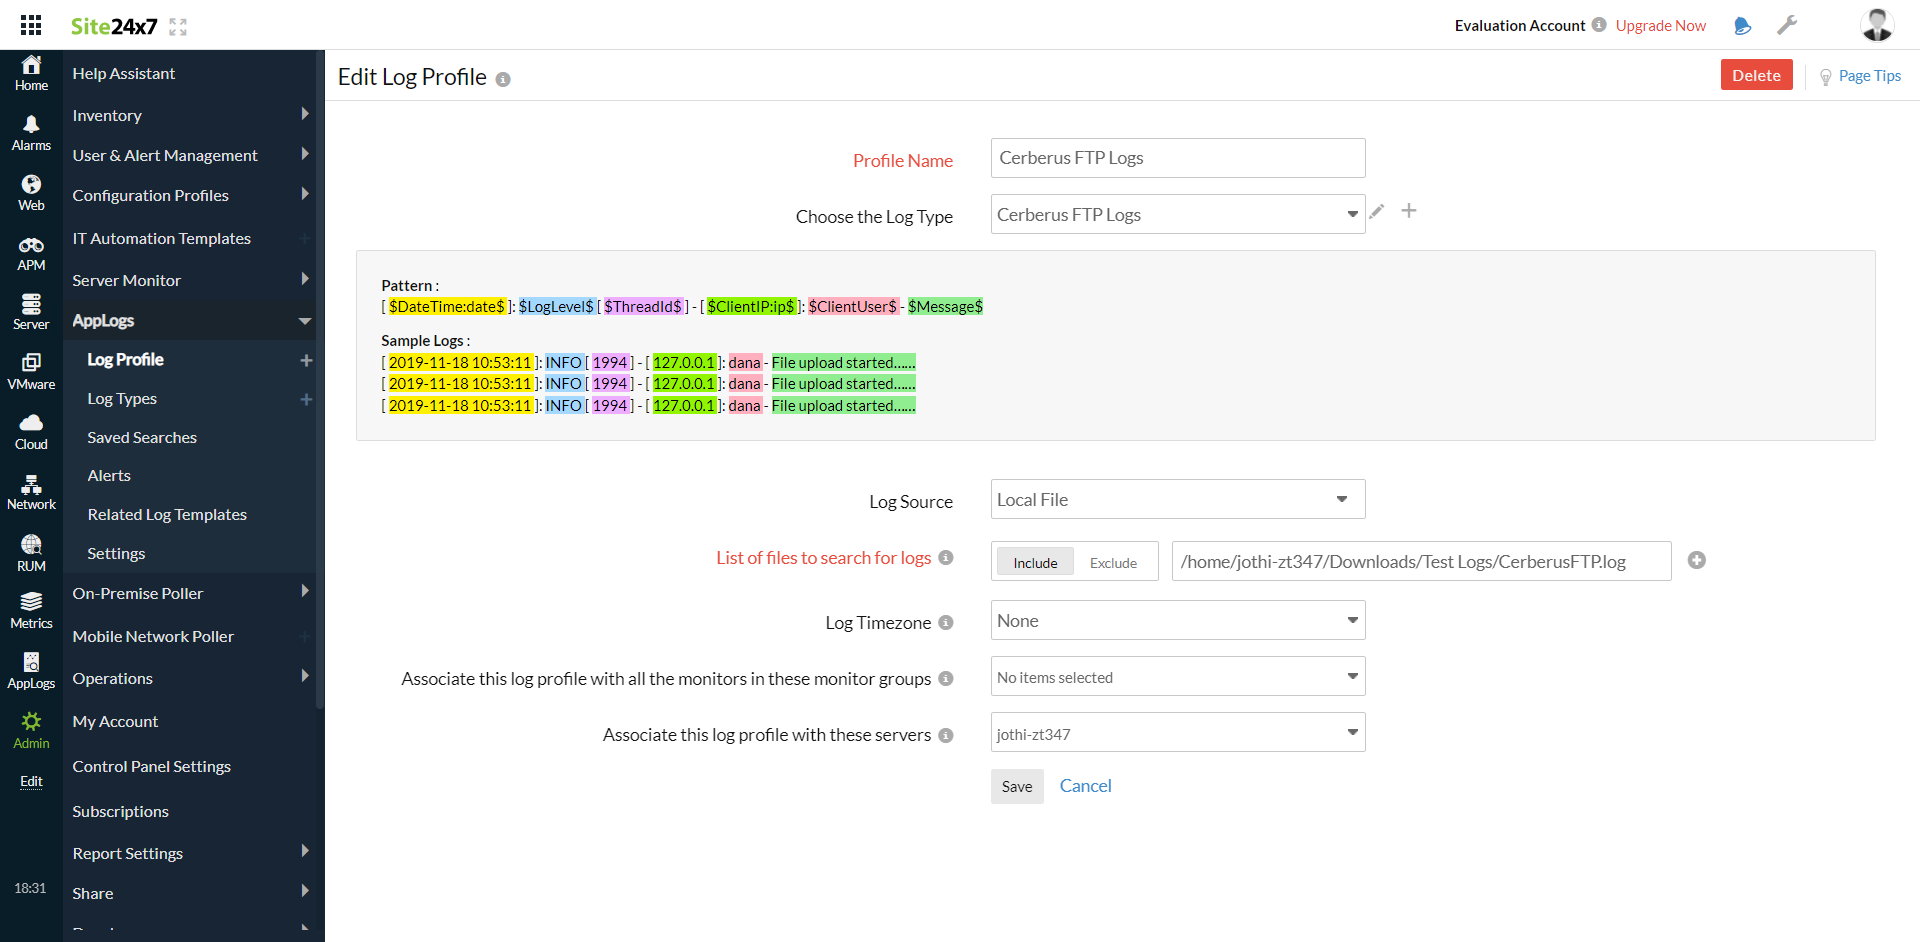
- The Pattern and Sample Logs are displayed below.
Sample Logs:
[2019-11-18 10:53:11]: INFO [1994] - [127.0.0.1]:dana - File upload started……
[2021-10-20 10:13:15]: REPLY [240547] - [173.248.161.42]: - HTTP/1.1 302 Redirected
[2019-11-18 10:53:11]: INFO [1994] - [127.0.0.1]:dana - File upload started……
This log is separated into fields, each of which takes its respective value and is then uploaded to Site24x7.
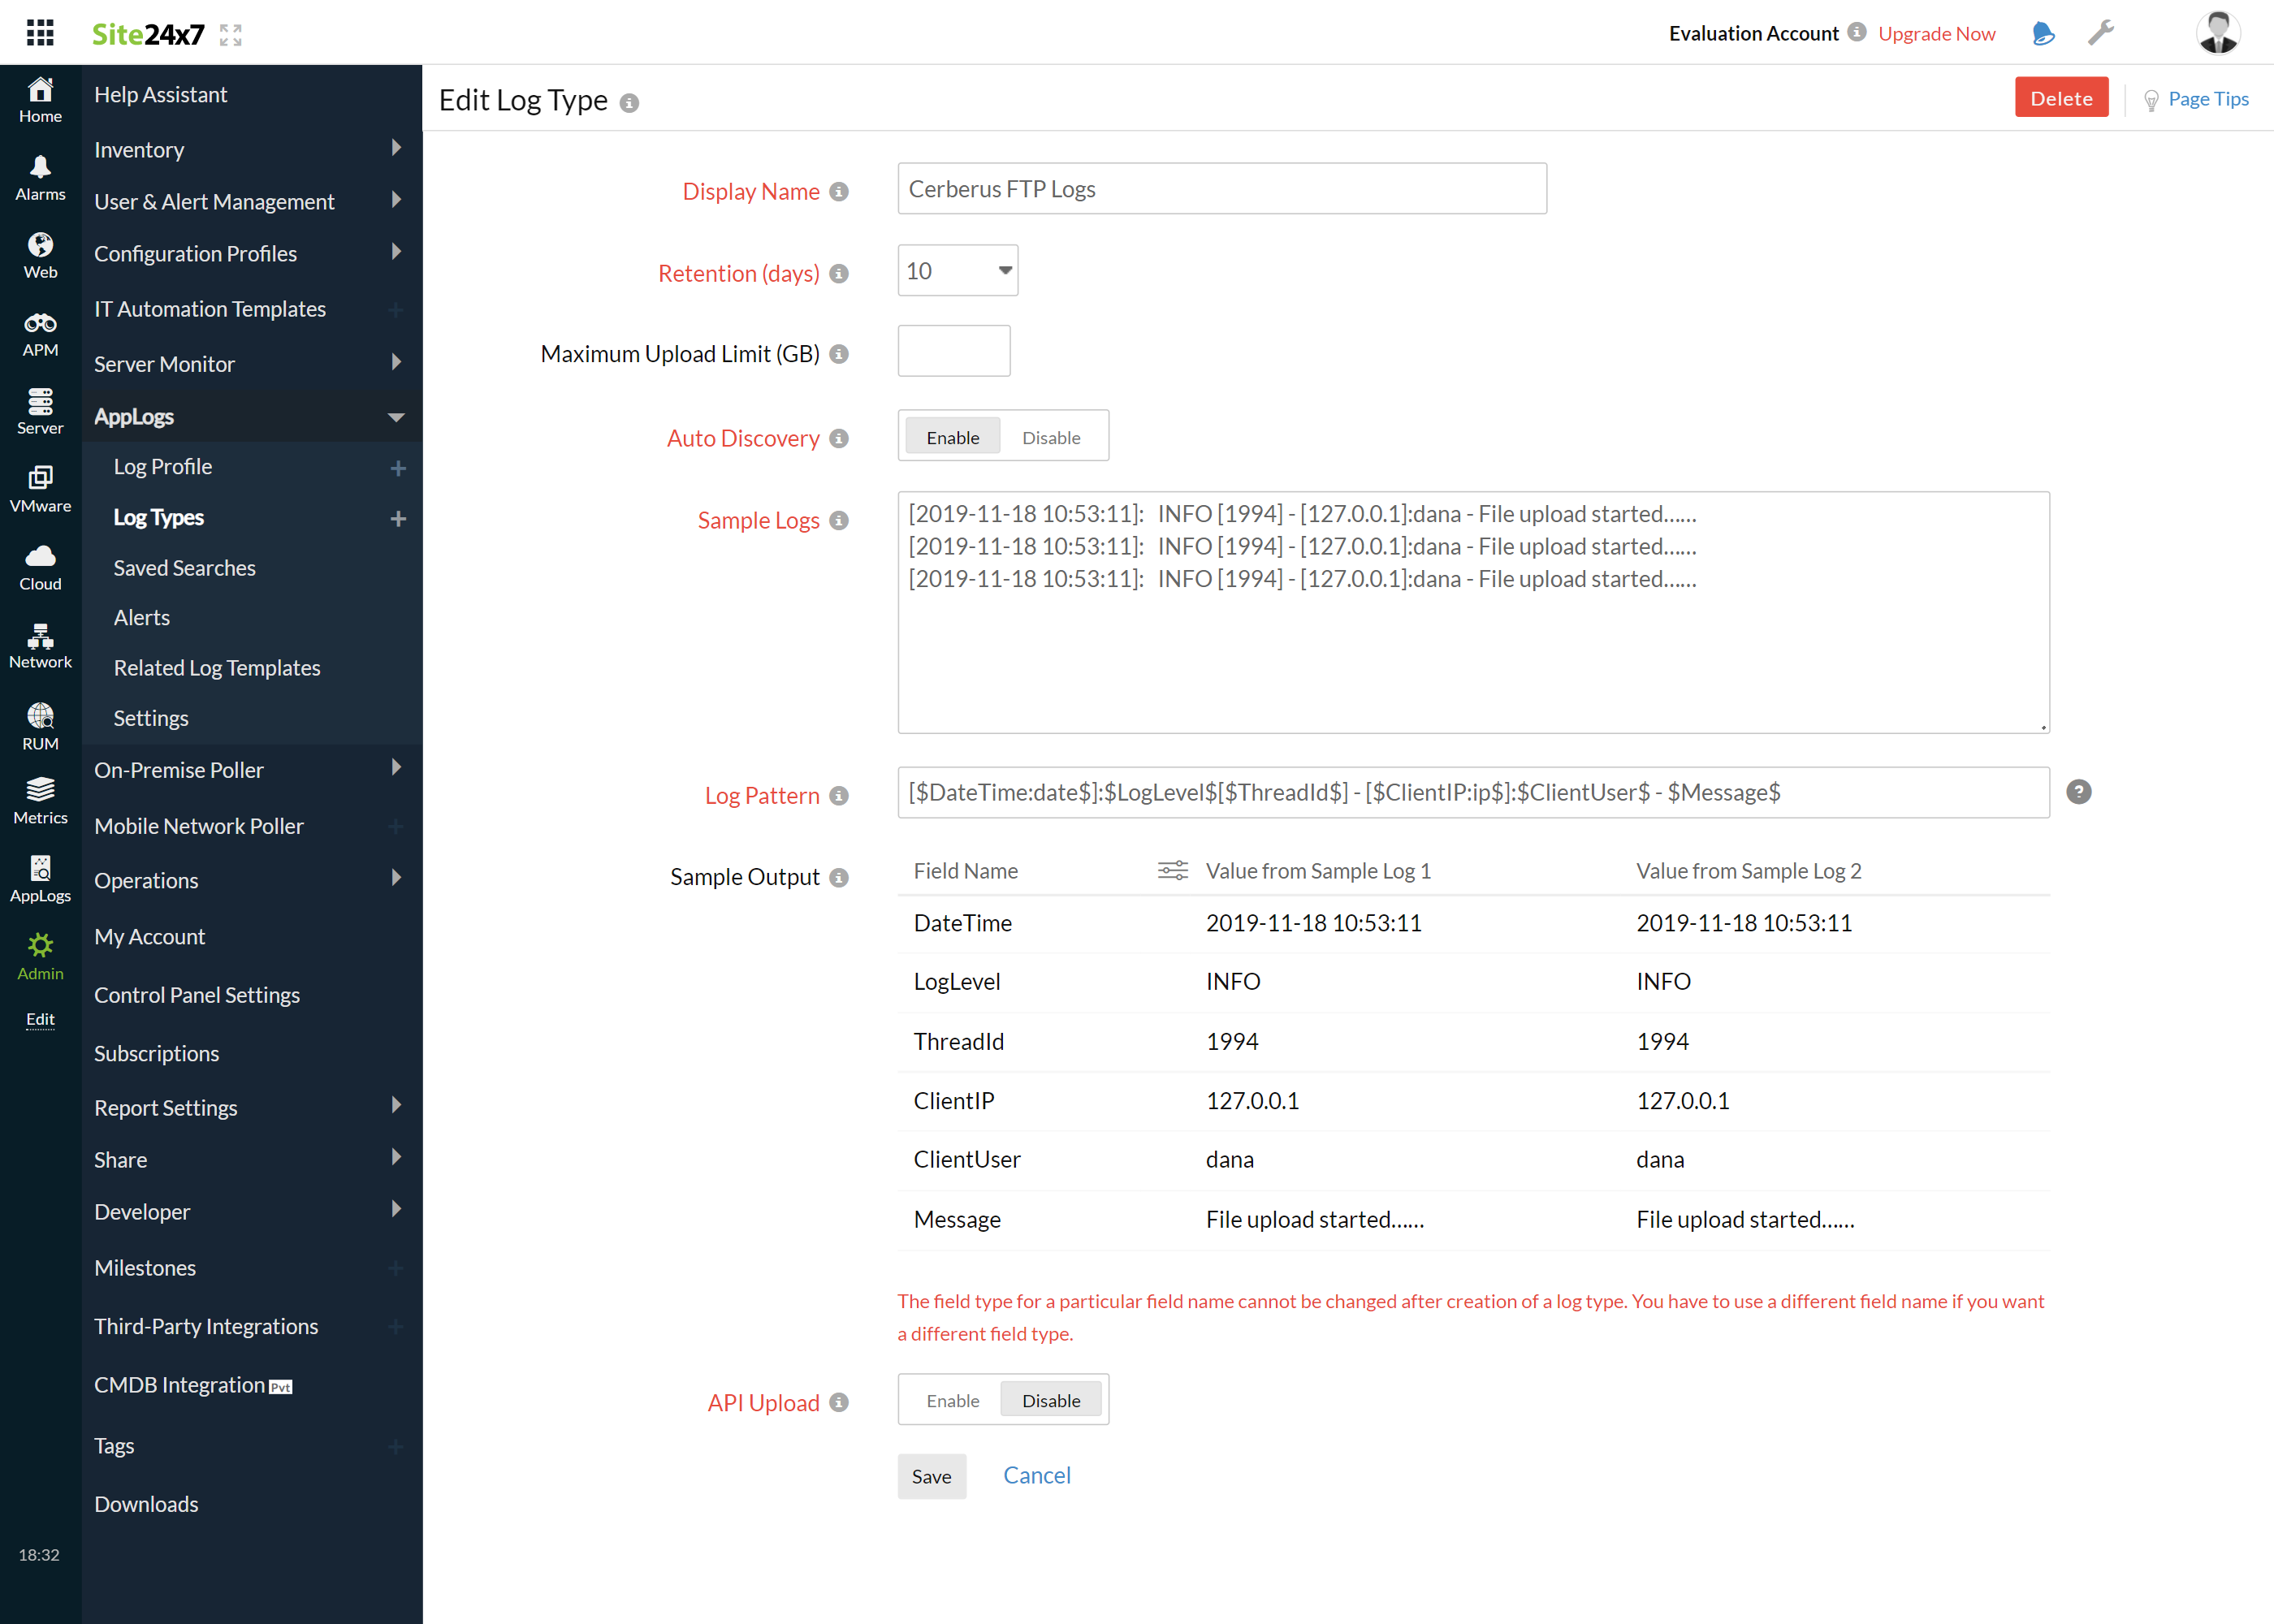
- By default, this is the log pattern identified by Site24x7 AppLogs for Cerberus FTP logs:
[$DateTime:date$]:$LogLevel$[$ThreadId$] - [$ClientIP:ip$]:$ClientUser$ - $Message$
- You can also add a custom Log Pattern instead of the default one. To do so, click the pencil icon and specify your pattern.

6. Select the Local File as Log Source.
7. By default, the paths below are used as the file source:
Linux: "C:\ProgramData\Cerberus LLC\Cerberus FTP Server\log\*.log"
- If your source path is different from the default path, specify it in the List of files to search for logs field.
8. Select either monitors or monitor groups to collect the logs.

9. Click Save.
Dashboard
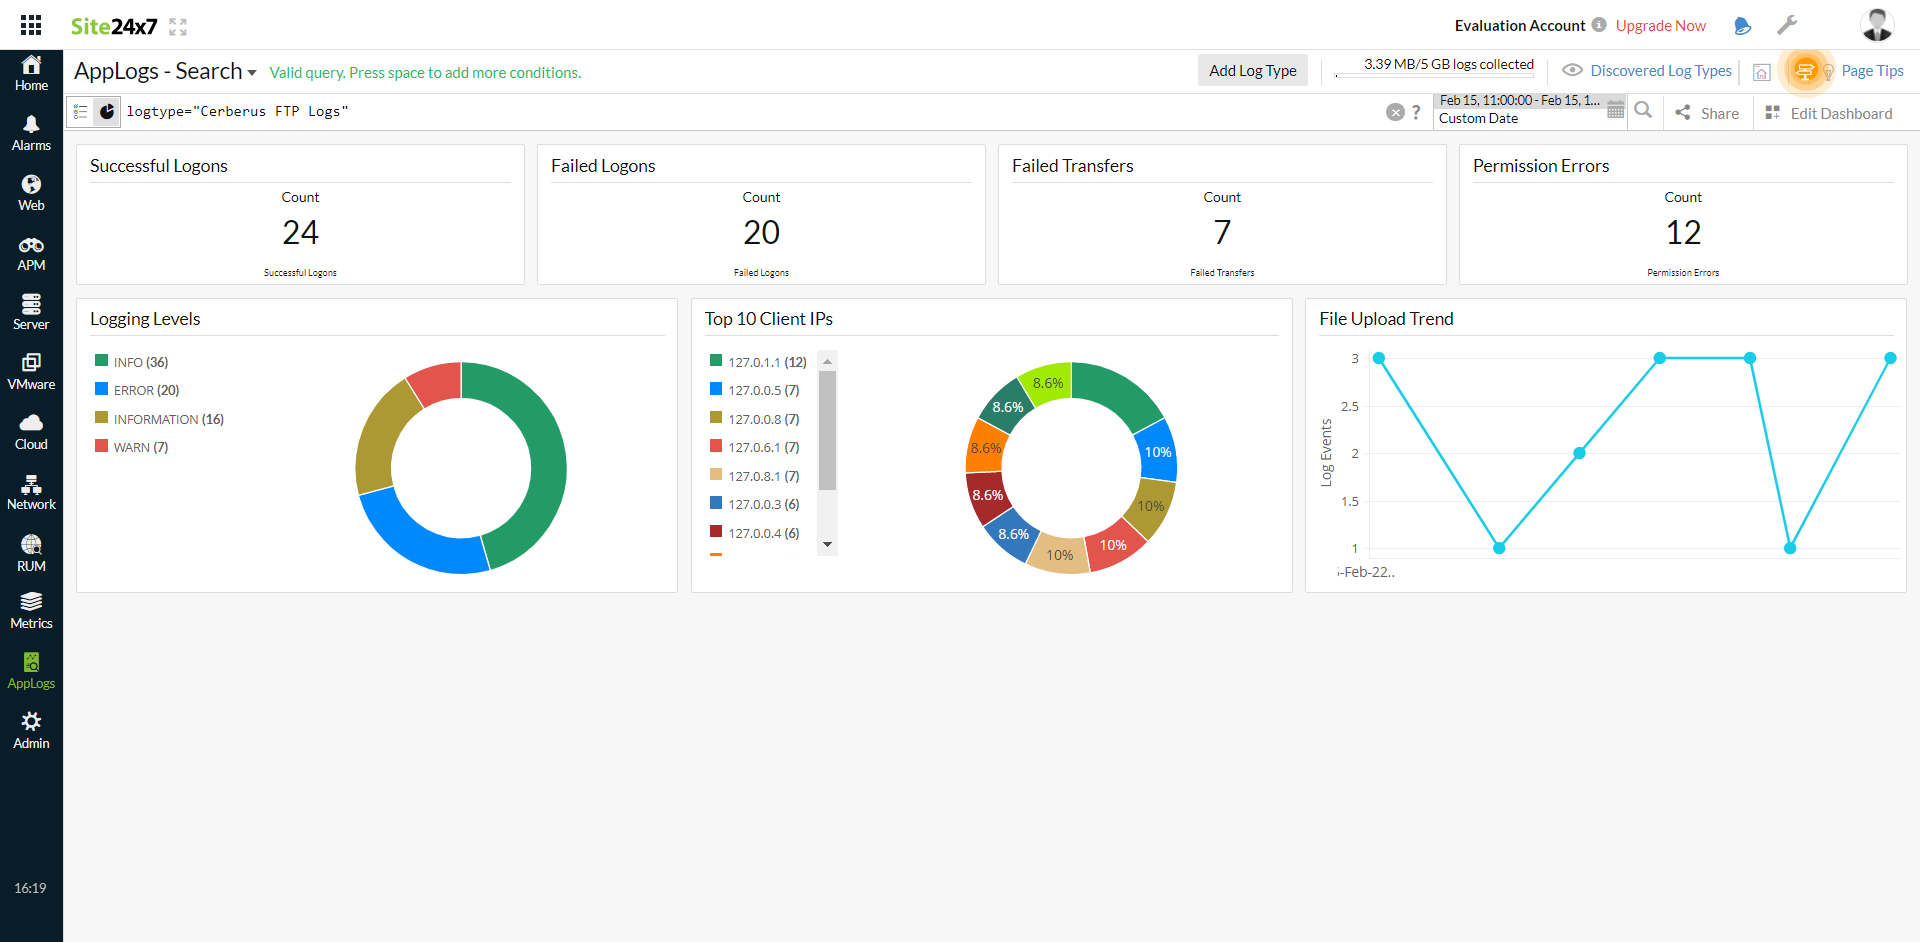
AppLogs creates an exclusive dashboard for every Log Type and shows a few widgets by default. Here's a list of the widgets available on the Cerberus FTP log dashboard:
- Successful Logons
- Failed Logons
- Failed Transfers
- Permission Errors
- Logging Levels
- Top 10 Client IPs
- File Upload Trend

Related log types
-
On this page
- Getting started
- Dashboard
- Related log types
