Performance Metrics of POP Server Monitor
Interpret POP Server Monitor
Site24X7's POP Server Monitor checks for the availability of your POP Server and alerts when the response time crosses the configured threshold. To interpret the monitoring results of your POP Server, navigate to Home and click the appropriate POP Server Monitor in the home screen. The results will be displayed under two main headings; Response Time and Availability and Response Time by Location. Metrics are laid out in graphical and tabular layouts.
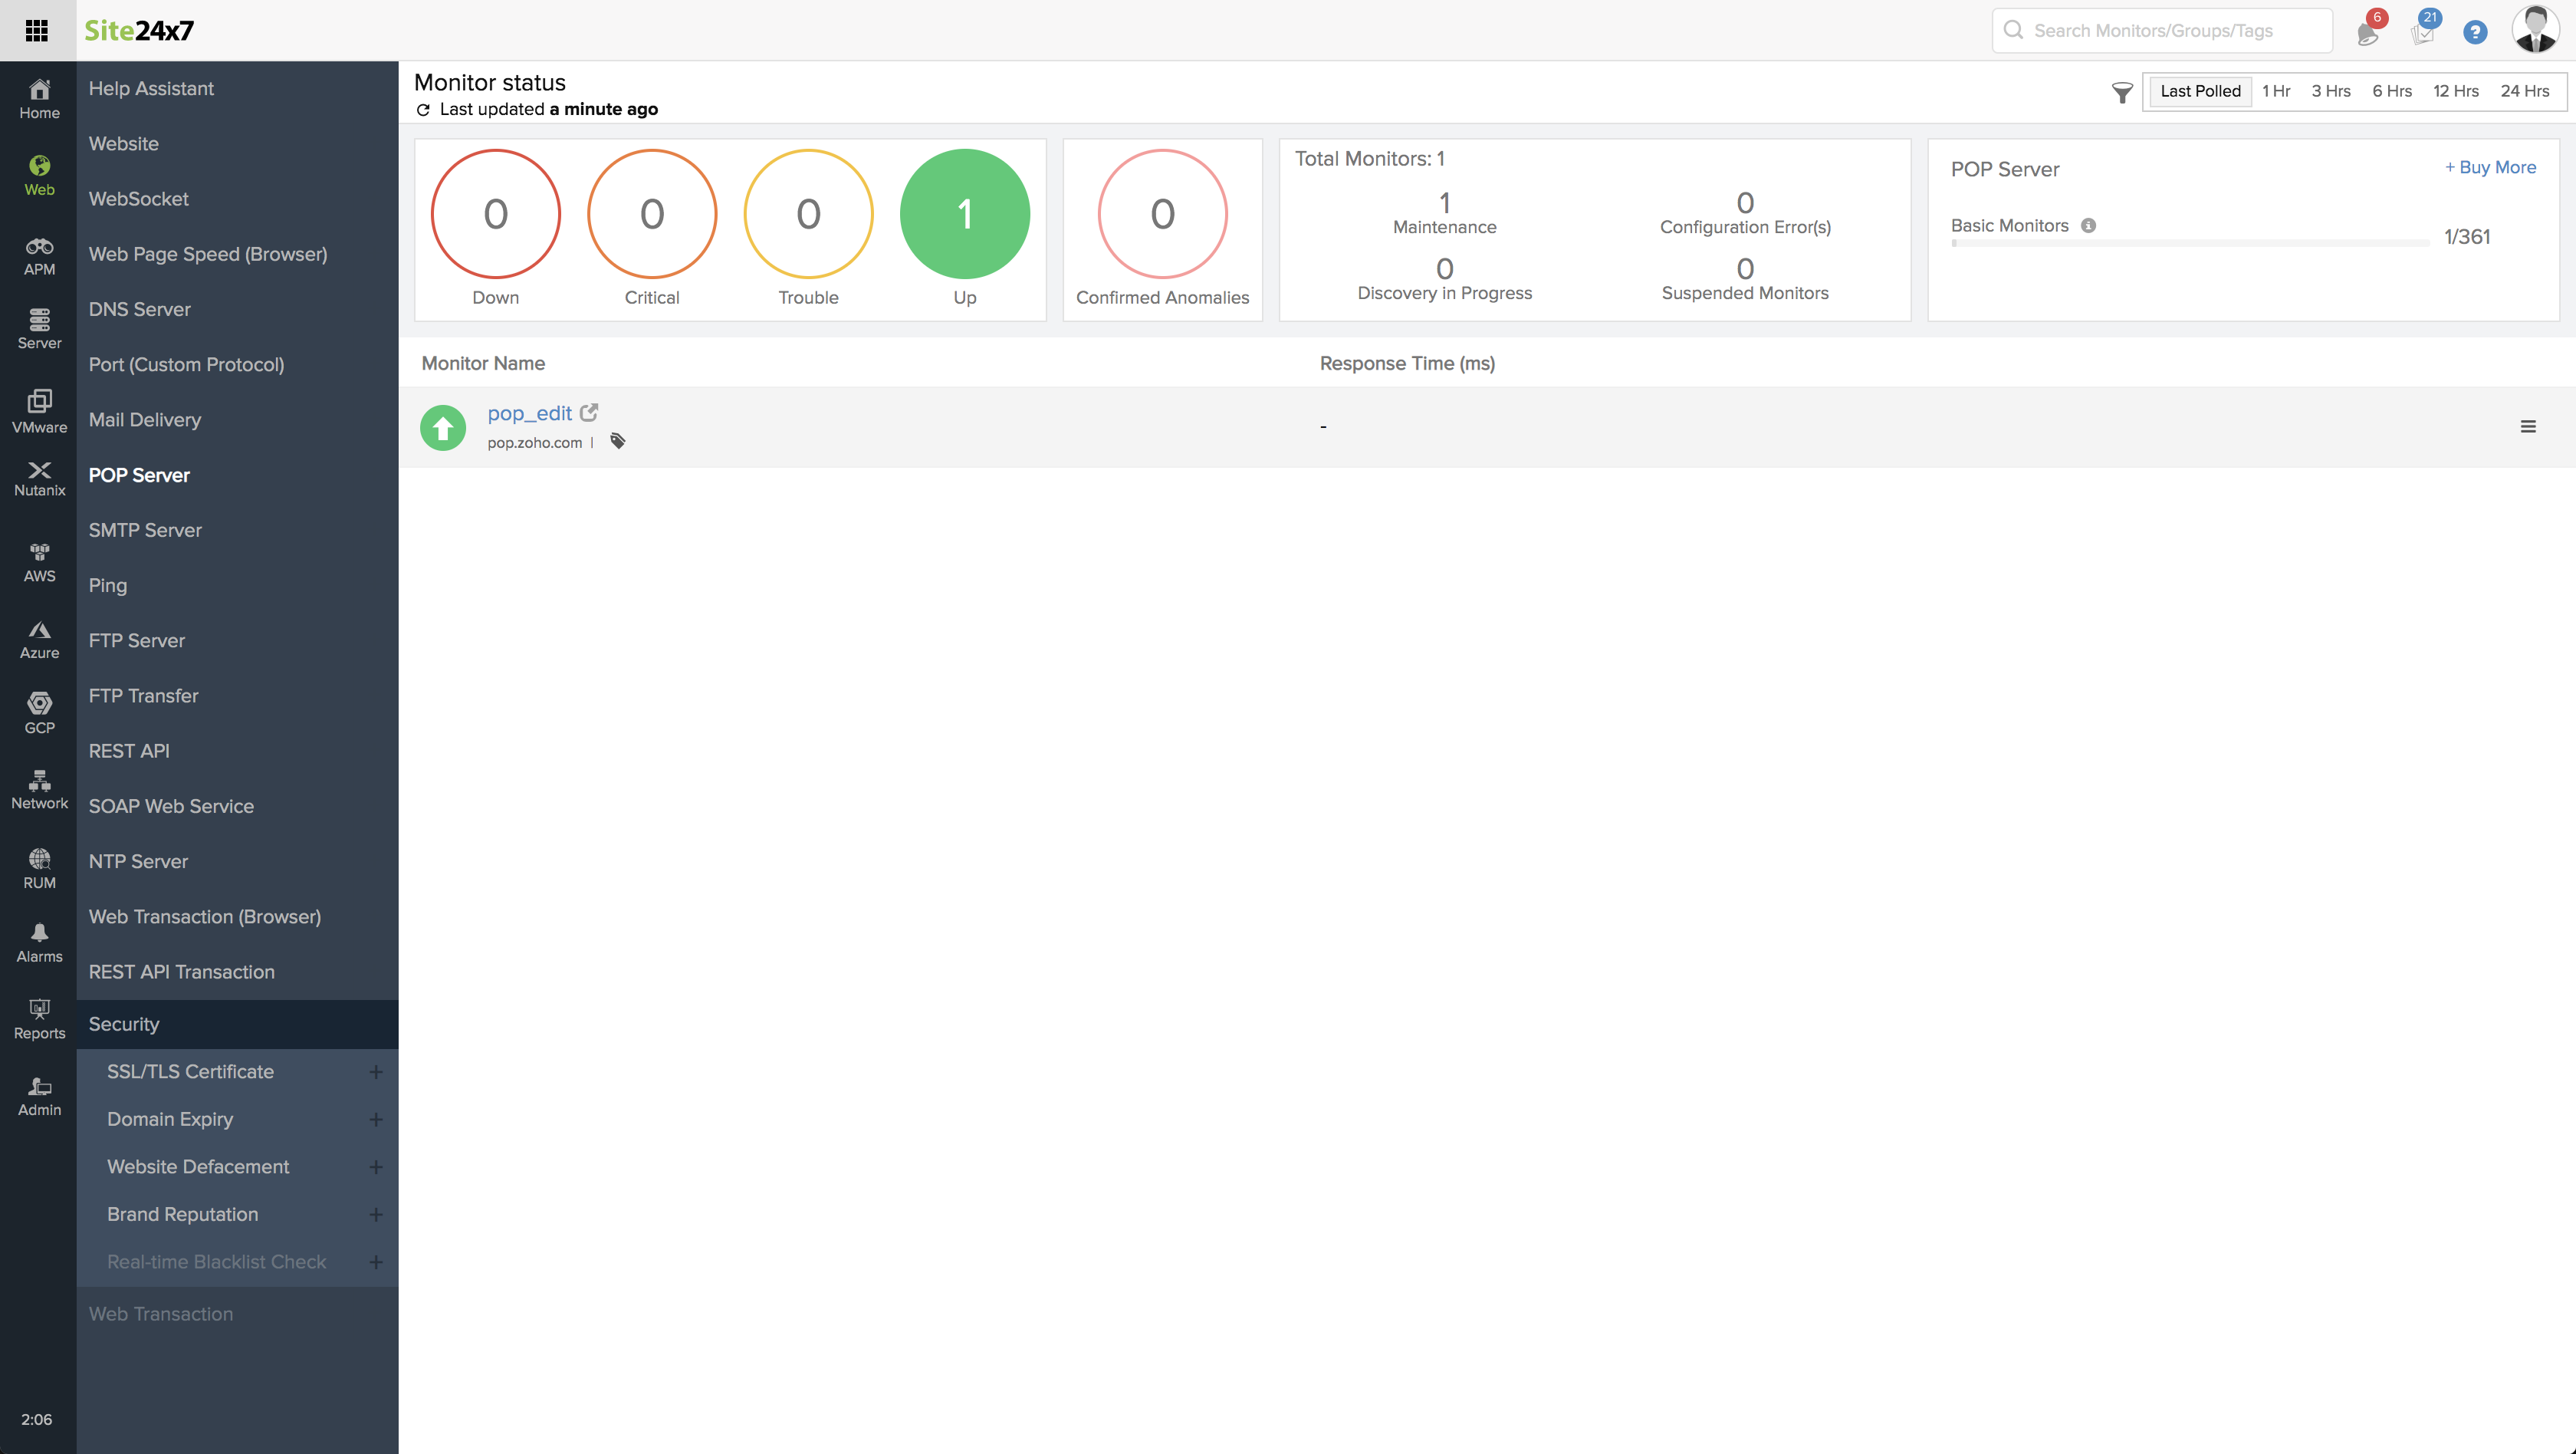
Site24x7's Web dashboard has a custom status banner, which identifies the various configured monitors by segregating them based on their operational status and state. You can also view the number of operational monitors and alert credits remaining in your account. By clicking the "+ Buy More" button, you can purchase additional monitors and alert credits. You can share the monitor details via an email. Email can be sent to only those verified users who have agreed to receive emails from Site24x7.
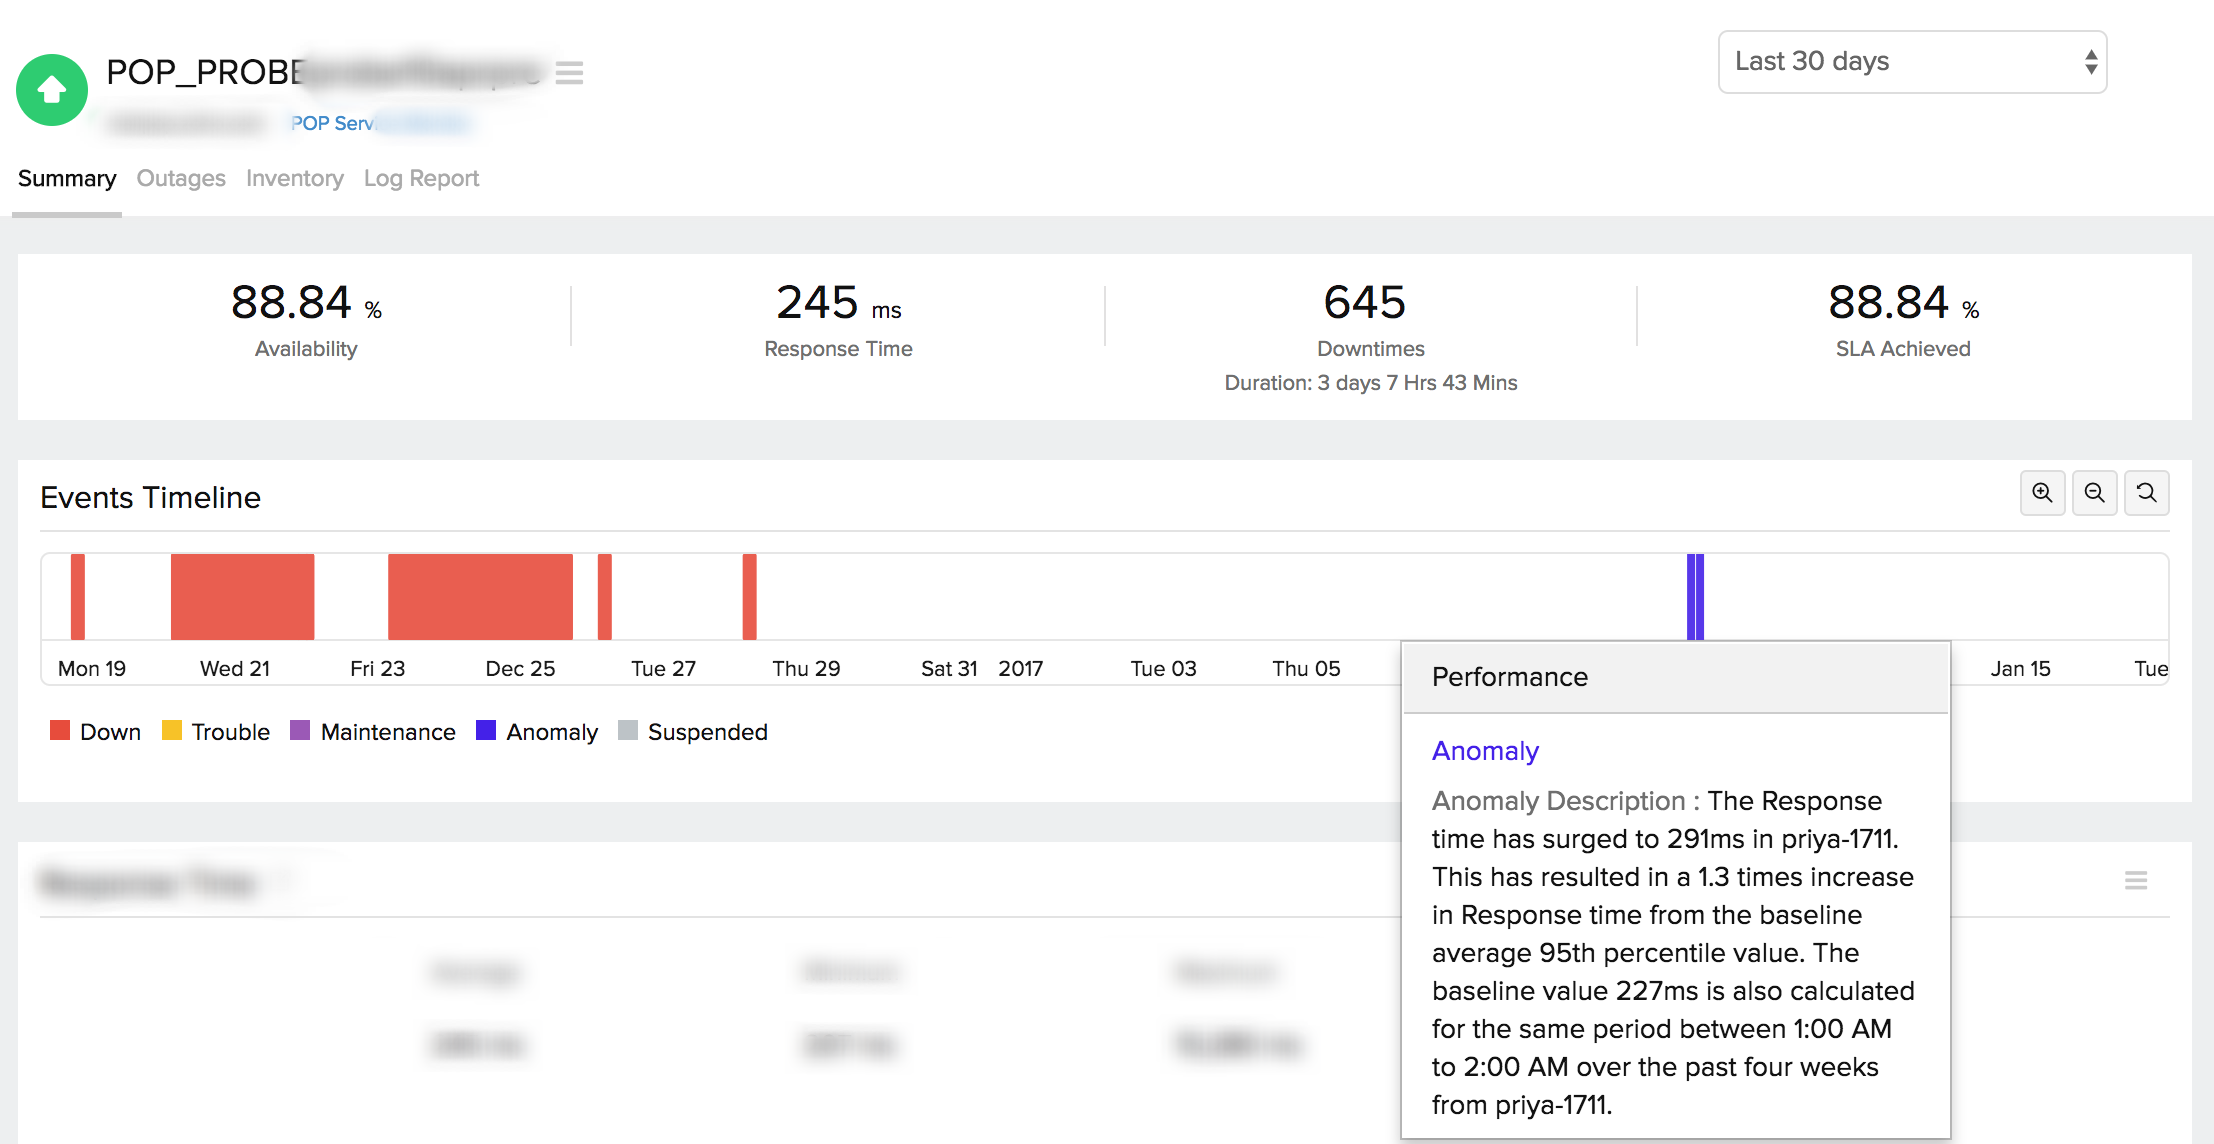
Events Timeline
Events timeline widget records all the past events of your selected monitor for a selected time range. You can identify/decode various events from the past, which includes Down, Critical, Trouble, Maintenance, Suspended, or Anomalies. Each event are color coded for easy identification. Events can be drilled down to extract maximum data and facilitate easy troubleshooting. You can also track the actual outage period and the total outage duration during a specific block of time.
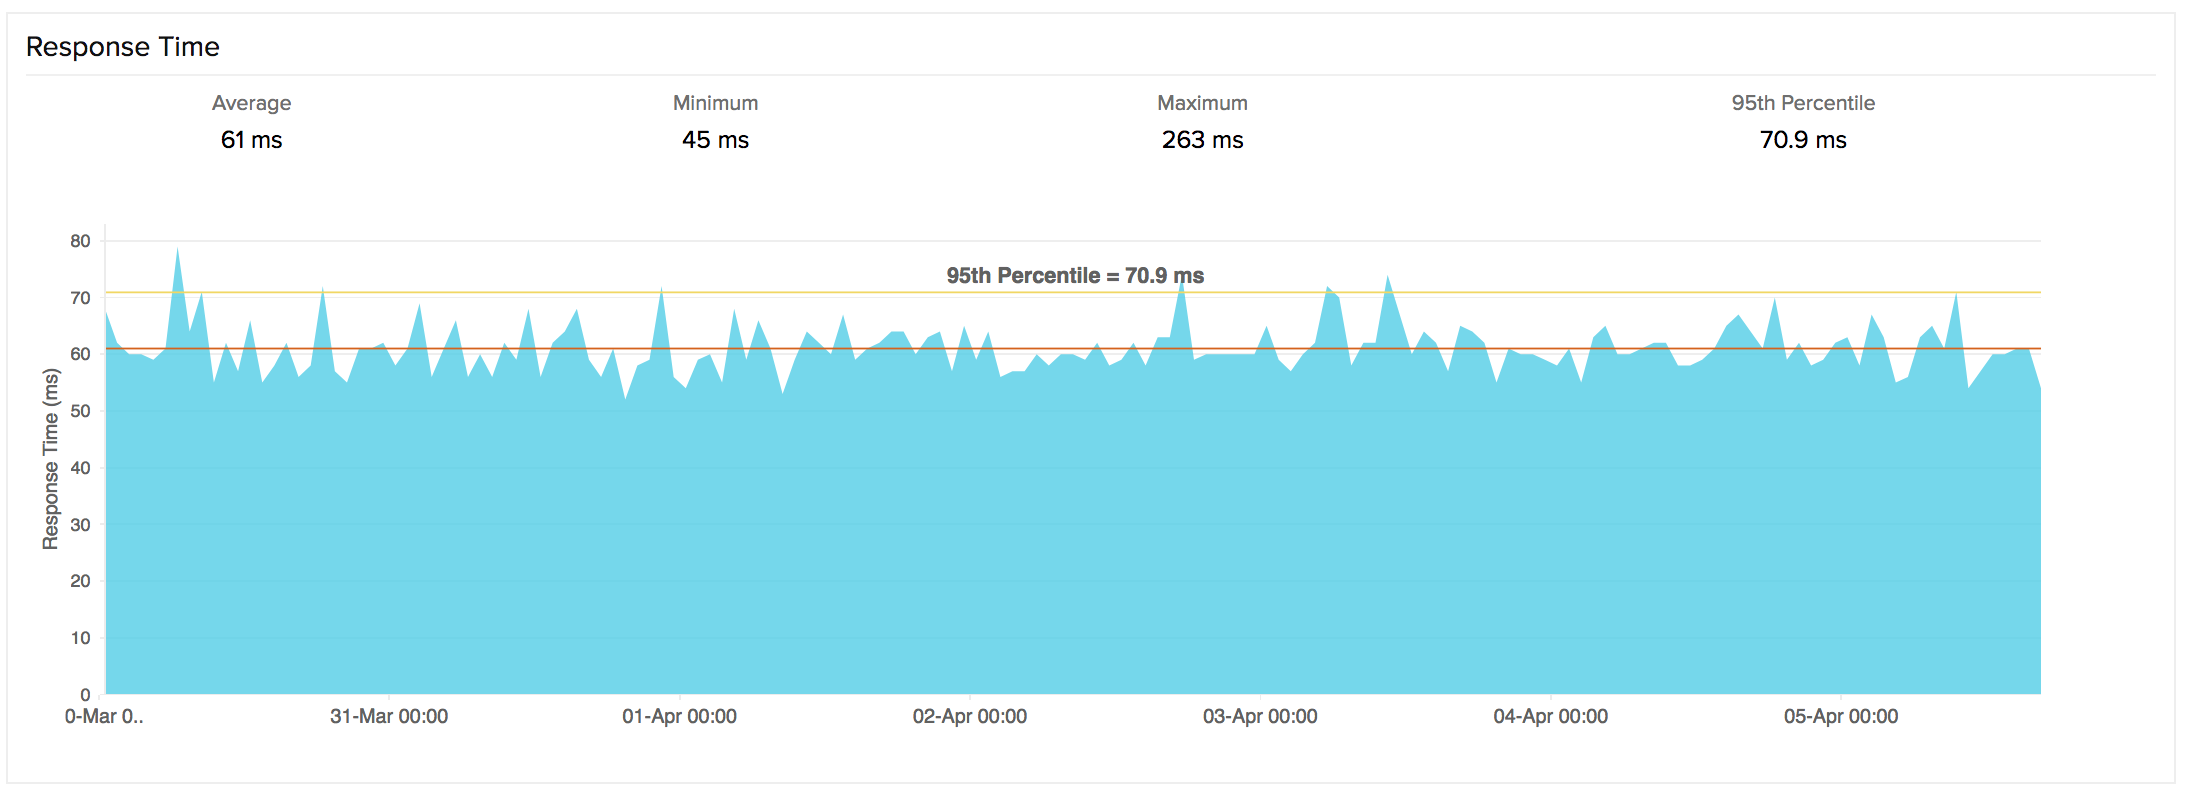
Response Time
Response Time indicates the total time in milliseconds needed to connect to POP Server over TCP port. The graph is computed by plotting time period against response time. Maximum, minimum and mean response time can be gauged from this graph. You can further filter out the three point, five point moving averages and also the 95 percentile by selecting the appropriate legends. The graph also lets you zoom in and isolate the exact data from the graphical spikes. You can also add specific notes to inform users about the various outages and maintenance activities.
Graphical Representation
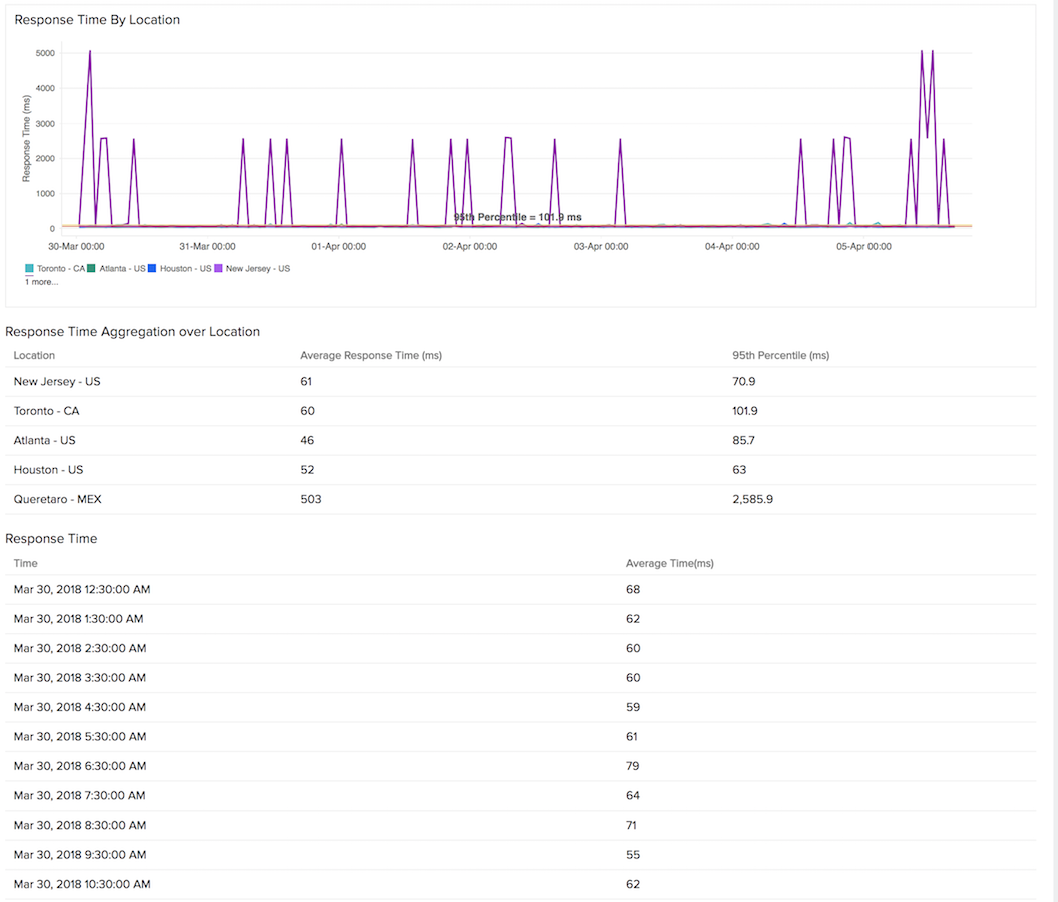
Response Time by Location
Response Time by Location graph shows the mean response time for each day or hour for each monitoring location. This graph can be employed to analyze the average/95th percentile response time of your monitors from different monitoring locations. Locations are identified using legends given with the graph. You can also filter out the location based reponse time by clicking on the legends.
Geo Map
The Geo Map provides a visualization of your POP server’s global availability from multiple monitoring locations. You can hover over different regions to view response time and other key metrics. This view helps you understand how efficiently your mail server handles POP requests across different geographies.
With the Geo Map, you can quickly identify regions experiencing delays in mailbox access, detect authentication or connectivity issues, and determine whether problems are localized or widespread. This enables faster detection and resolution of email retrieval issues.
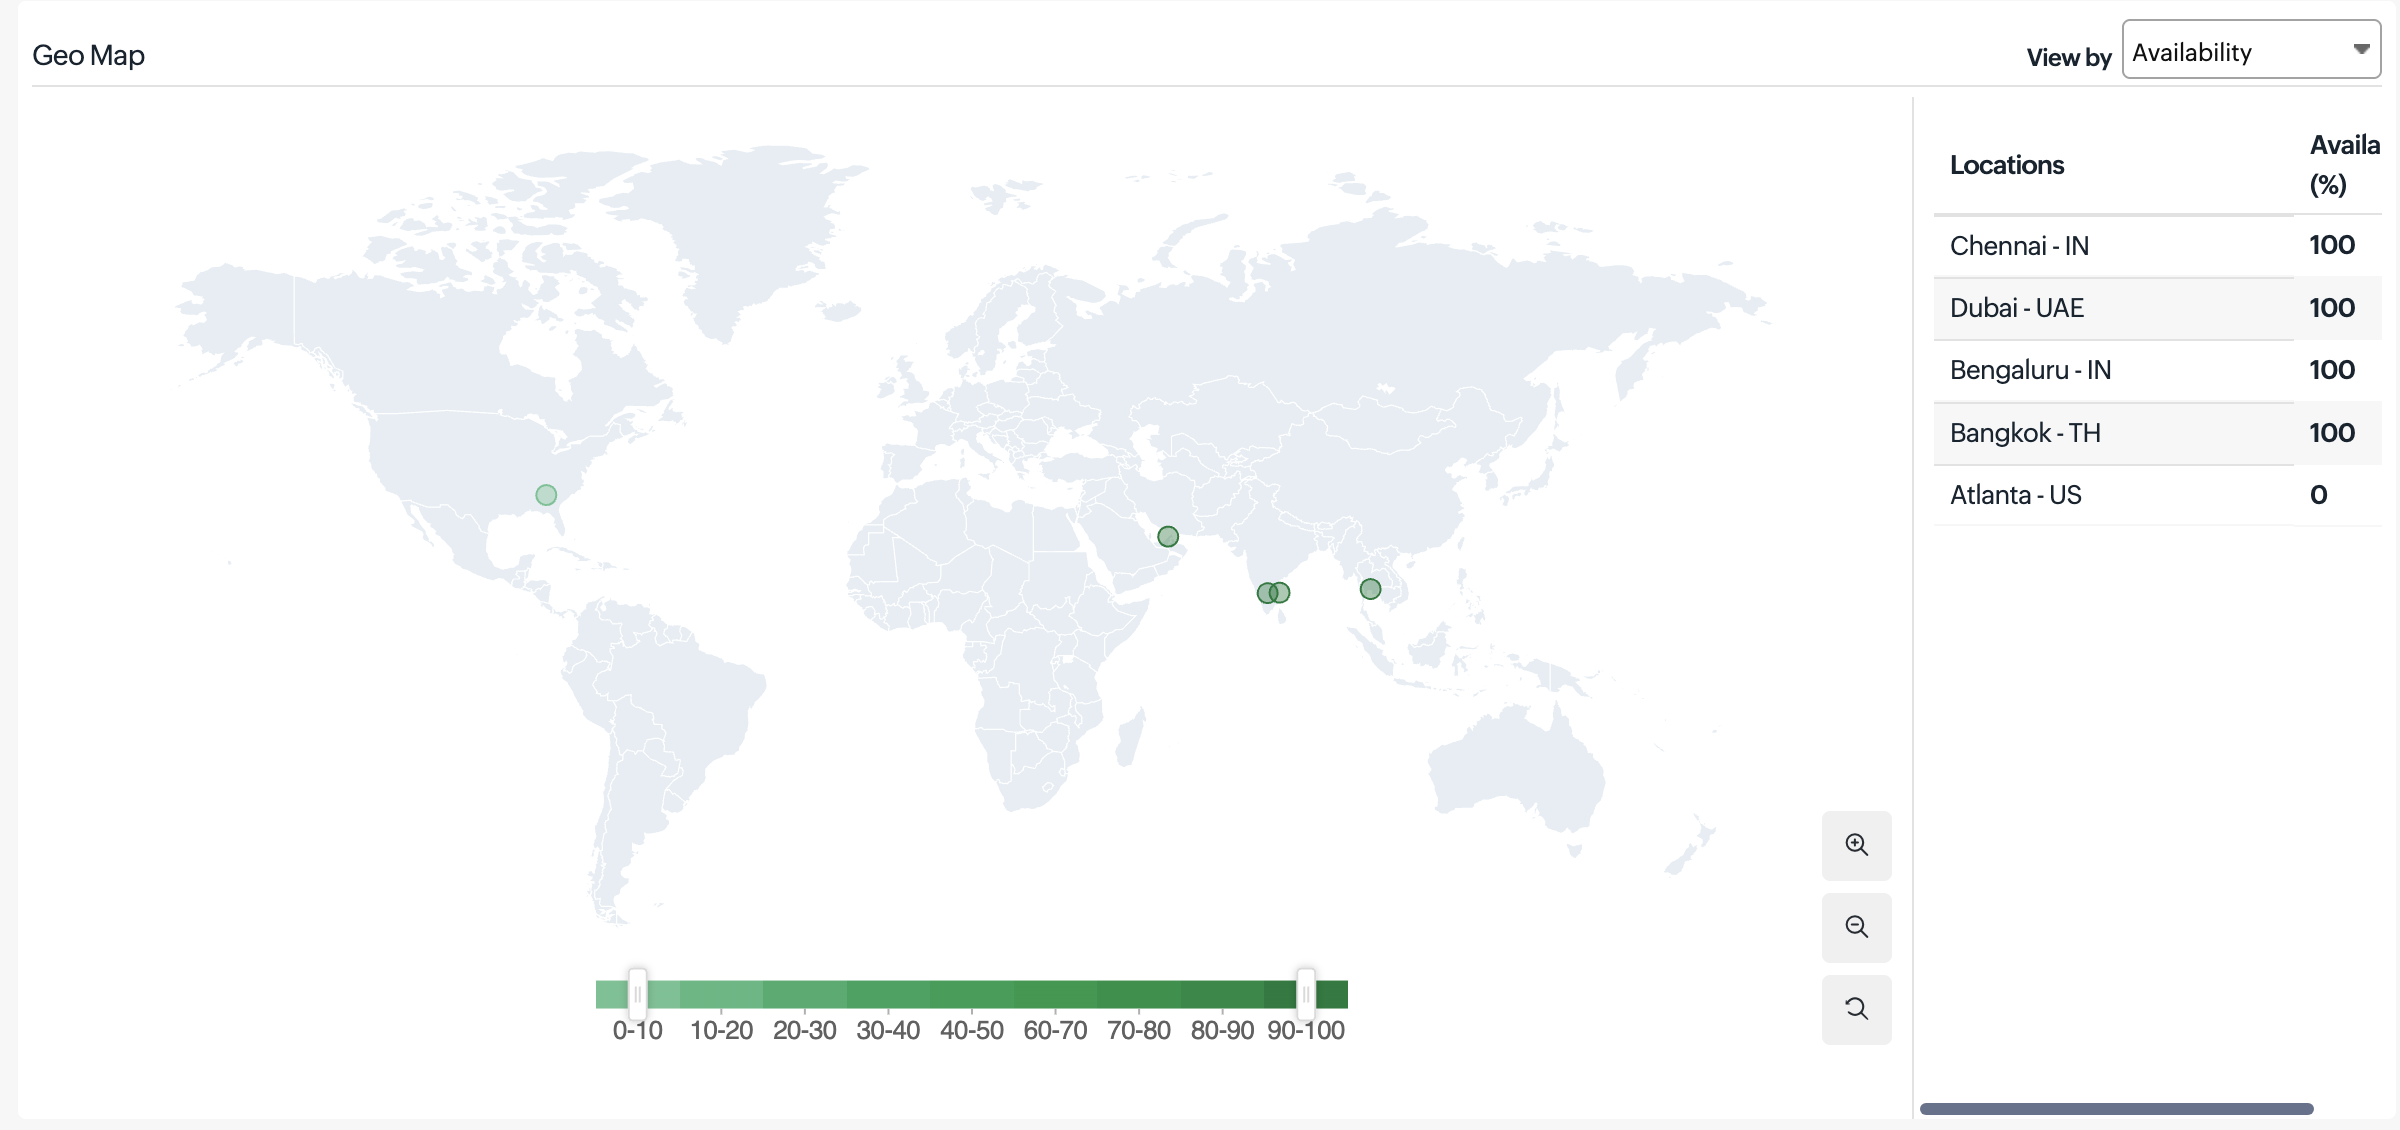
View by metrics
Select a metric to visualize availability and performance across locations. The Geo Map dynamically updates to reflect the chosen metric, allowing you to analyze trends.
- Response Time: Displayed using color gradients (green for faster responses and red for slower). Bubble size increases with higher response time and decreases with faster mailbox retrieval, helping you identify latency-prone regions. Hovering over a location displays a tooltip with details such as monitoring location, response time, and transaction status.
- Availability (%): Represents the percentage of successful POP connections and mailbox retrievals from each monitoring location. A color gradient (green for high availability, red for low) highlights regions experiencing login failures, timeouts, or connectivity issues. Hovering over a location displays a tooltip with availability metrics.
- Current Status: Indicates the real-time status of each monitoring location. Green markers represent locations where the POP server is reachable and mailbox retrieval is successful (Up), while gray markers indicate resolved IP locations. This view helps you quickly assess the operational status of POP checks across all regions.
Updates
You can view the real-time data from the various poll cycles and it includes the outages and trouble alerts data.

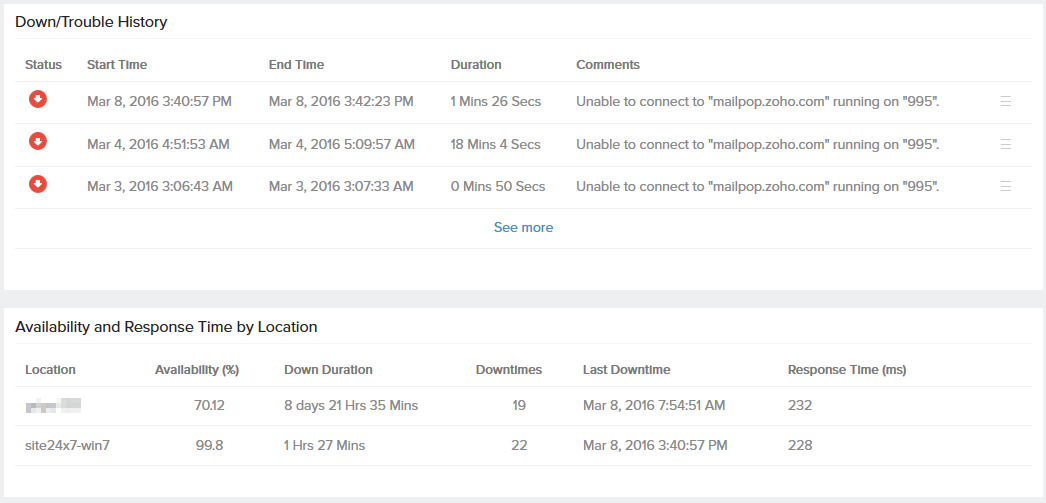
Down/Trouble History
It offers detailed insight into the trouble history of your monitor. You can view the status, the exact downtime, duration, and specific reason for the down status.
Outages
You can access the Outages tab in your monitor's details page to gather detailed insights on the various outage and maintenance downtimes. It provides you with sufficient information to troubleshoot issues. You'll also be able to access the root cause analysis reports for your various outages. On accessing the ![]() icon of a listed monitor outage or maintenance, you'll be shown the options to:
icon of a listed monitor outage or maintenance, you'll be shown the options to:
- Mark as Maintenance: Mark an outage as Maintenance
- Mark as Downtime: Mark a Maintenance as Downtime
- Edit Comments: Add/Edit Comments
- Delete: Delete an Outage/Maintenance permanently
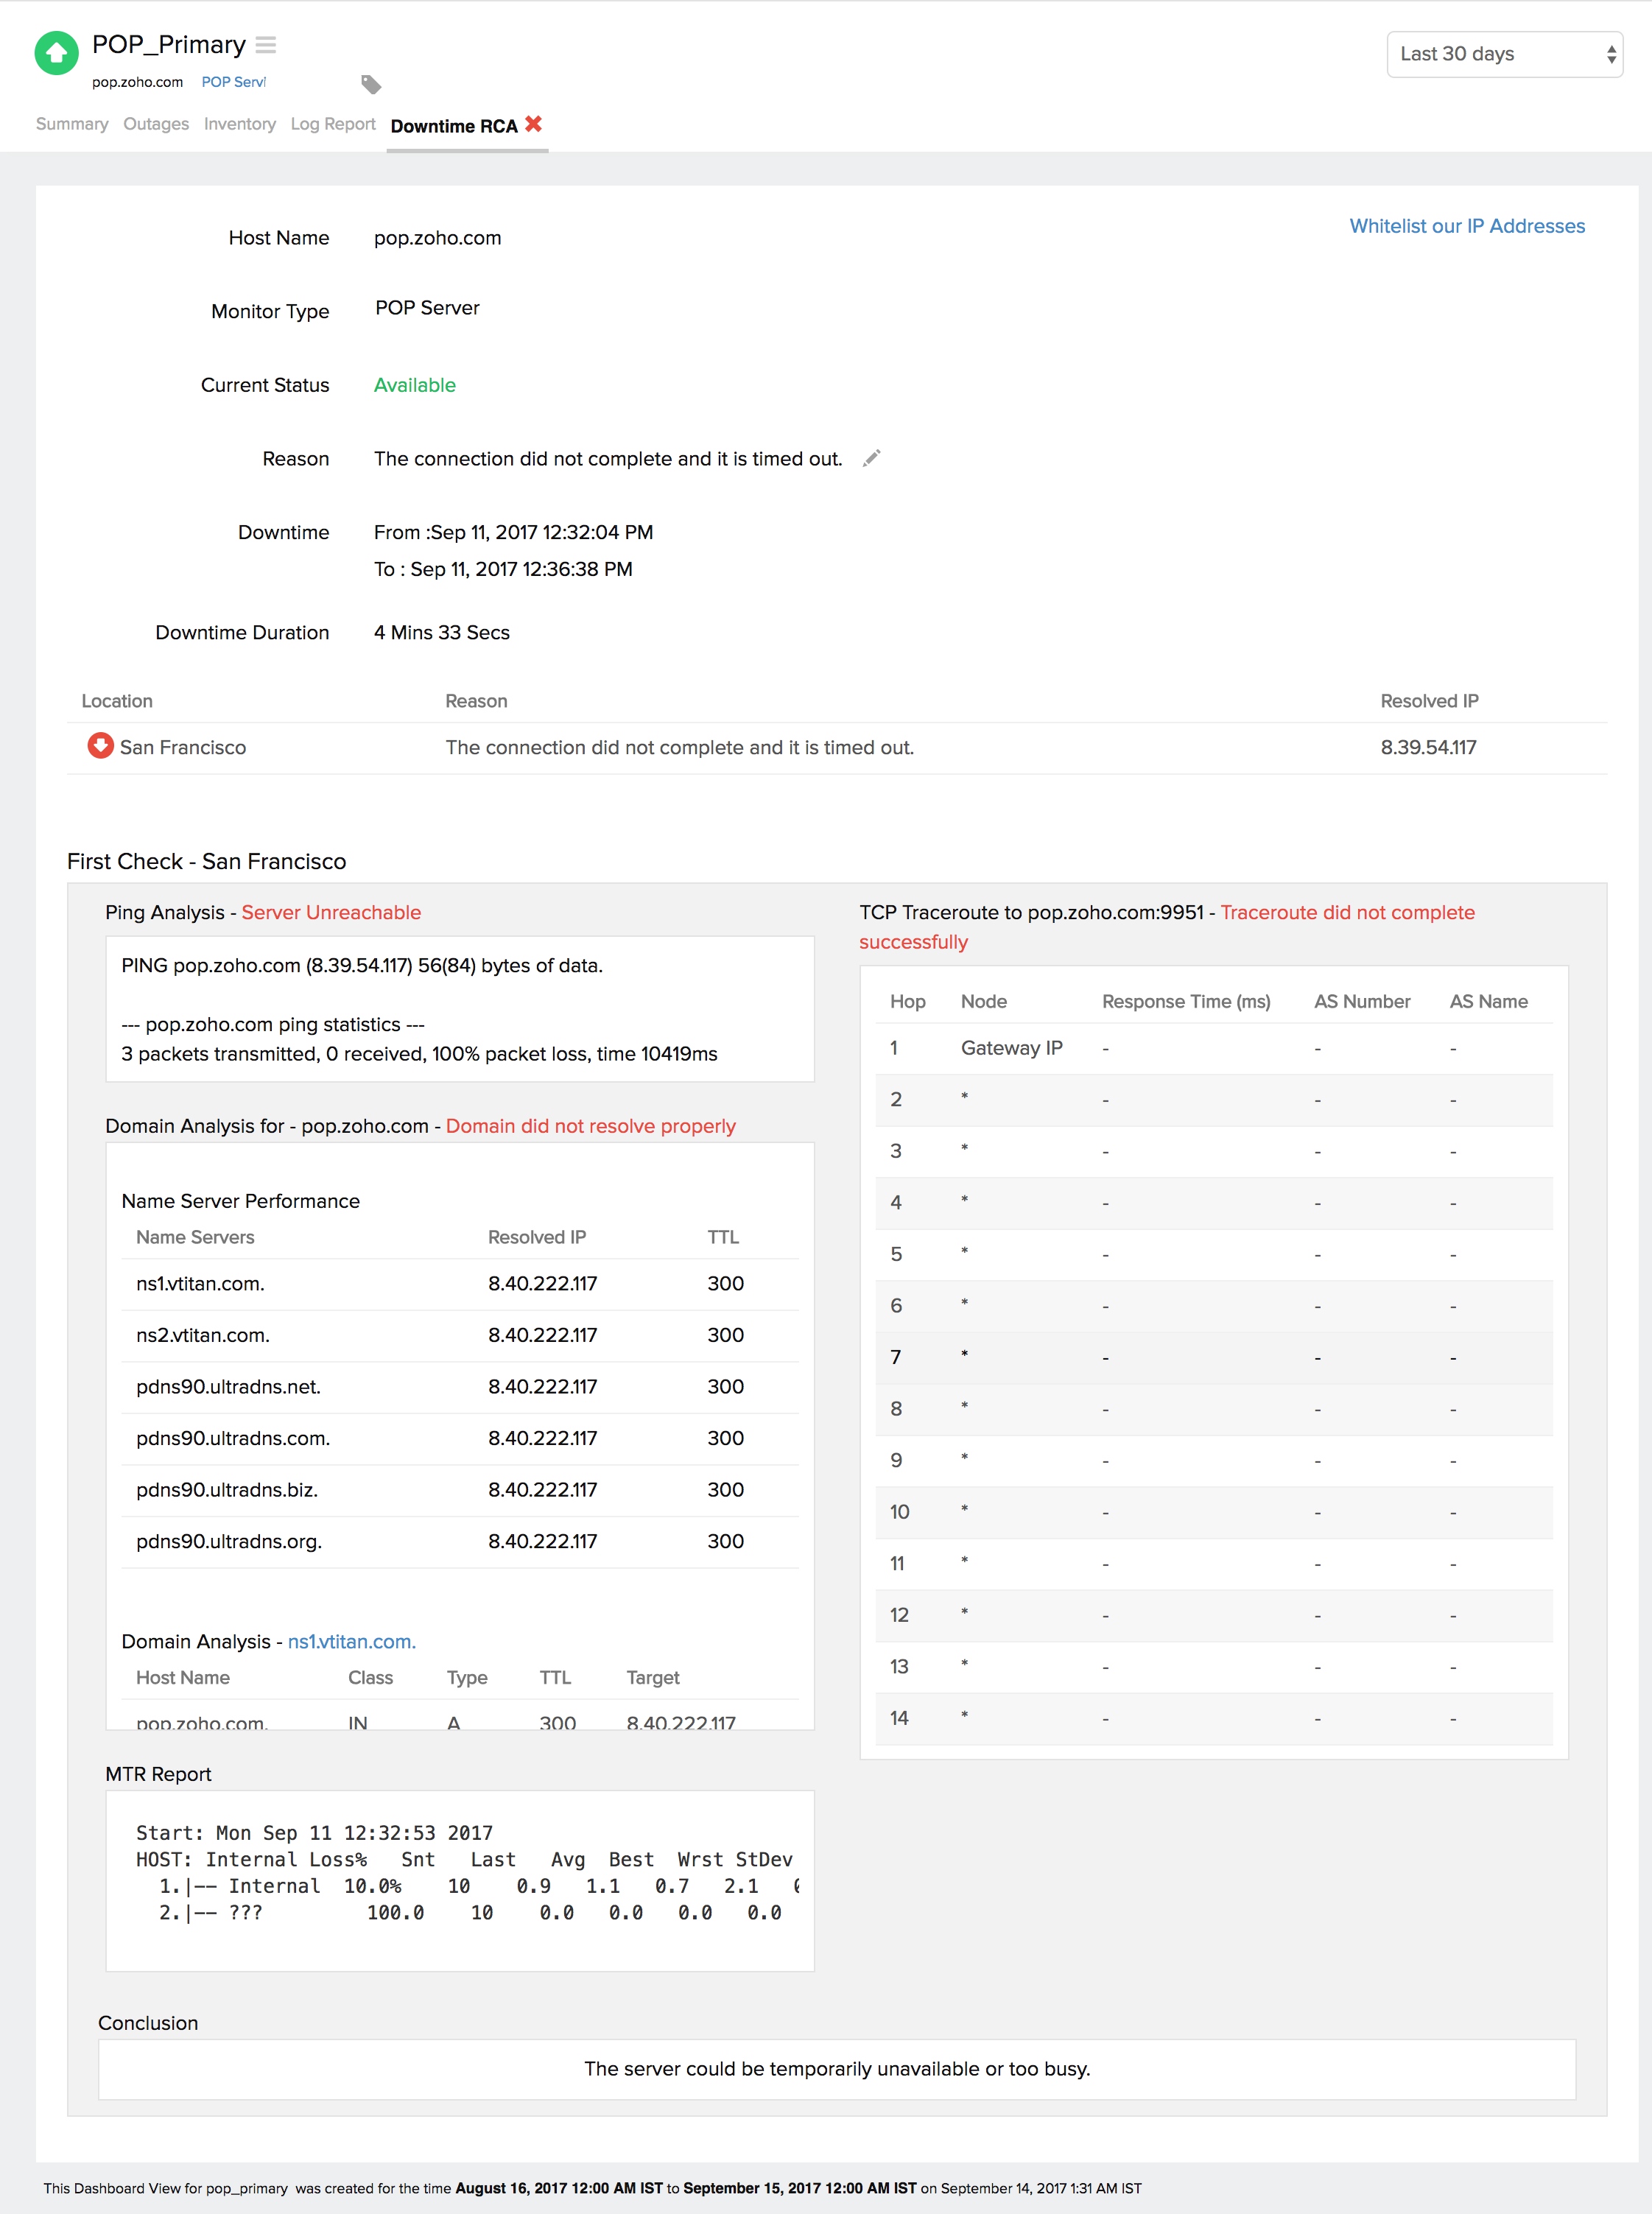
Root Cause Analysis (RCA) Report
You can retrieve indepth root cause analysis report for your DOWN monitors after 150 seconds of the monitor reporting the outage. RCA Report gives basic details about your monitor, outage details, recheck details and reasons for the outage. Root Cause Analysis automatically generates a plethora of information to arrive at a definite conclusion as to what triggered a downtime. RCA intends to determine the root cause of specific downtime or performance issue. A normal RCA report will comprise of the following details:
- Checks from Primary location and re-checks from Secondary location.
- Ping Analysis
- DNS Analysis
- TCP Traceroute
- MTR Report
- MTR based Network Route
- Conclusion
Availability & Response Time by Location
Availability and Response Time of the POP Server from configured monitoring locations is depicted in a tabular format. The total availability percentage, Response Time (ms) and down duration from each monitoring location can be inferred from this report.
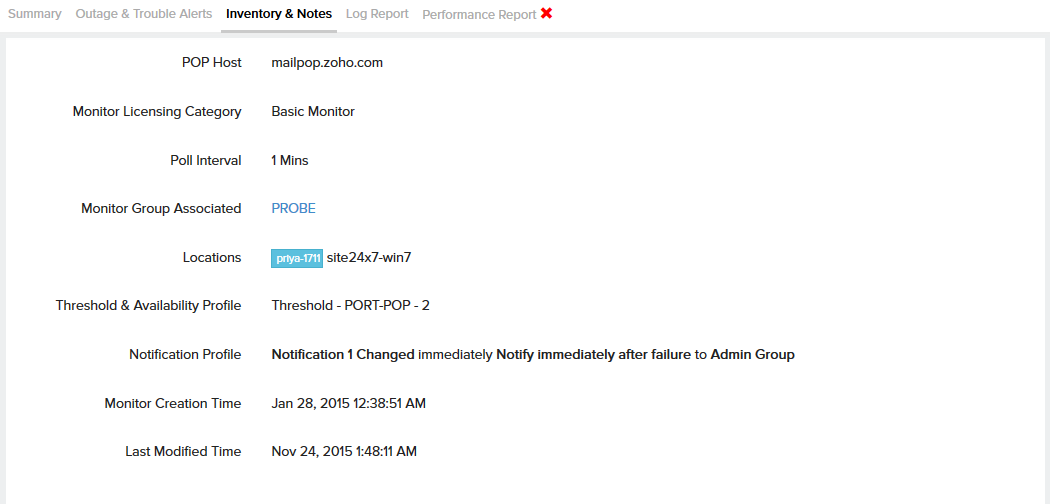
Inventory and Notes
This section captures the basic monitor information and also its various configuration settings including polling locations, poll interval, licensing type, and more.
Log Report
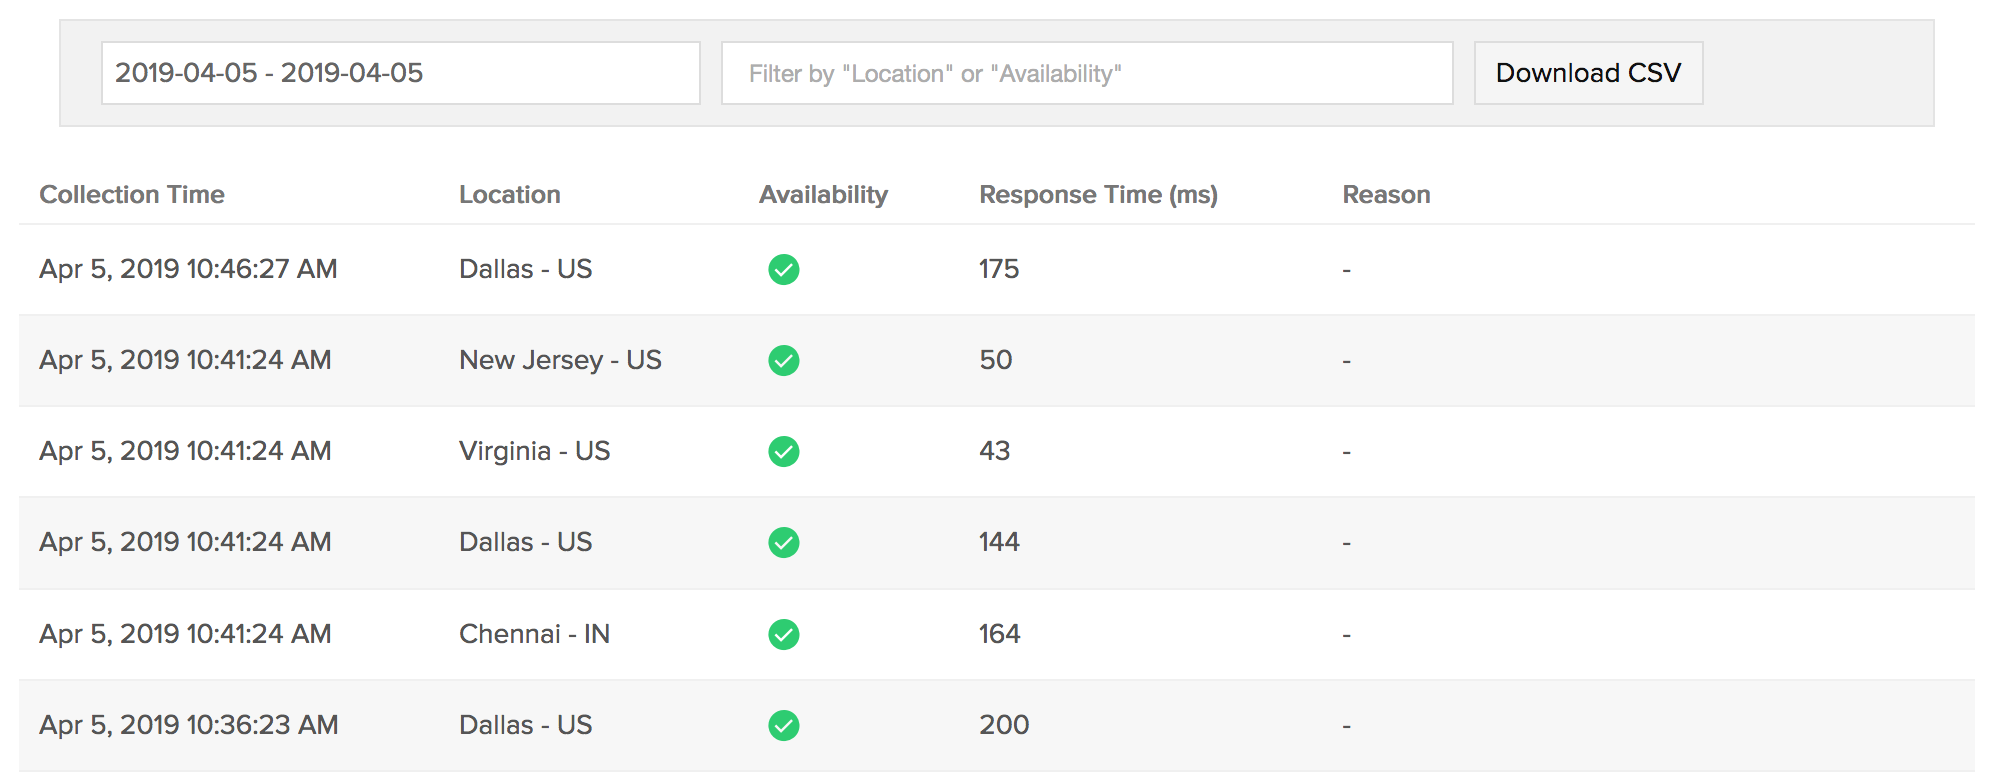
With our integrated log records for individual monitors, you can get an indepth knowledge about the various log details for the configured monitor, over a custom period. You can also filter the log based on location and availability. You have an option to download the log report in CSV format.
Learn more: How to set up a POP Server Monitor?
