Amazon RDS for PostgreSQL and Amazon Aurora PostgreSQL monitoring
Keep an eye on the availability and efficiency of your Amazon Relational Database Service (RDS) PostgreSQL or Aurora PostgreSQL instances by tracking the key performance indicators, including the connections, back-end processes, cache hit ratios, rows fetched and returned, deadlocks, transactions, and locks.
Adding an Amazon RDS for PostgreSQL or Aurora PostgreSQL monitor
Prerequisites:
- Log in to the AWS console.
- Choose the appropriate region where you are planning to monitor the database. Example: US East (N. Virginia), Asia Pacific (Mumbai), Canada (Central), etc.
- Navigate to Services > Database > RDS and select the database instance you want to monitor.
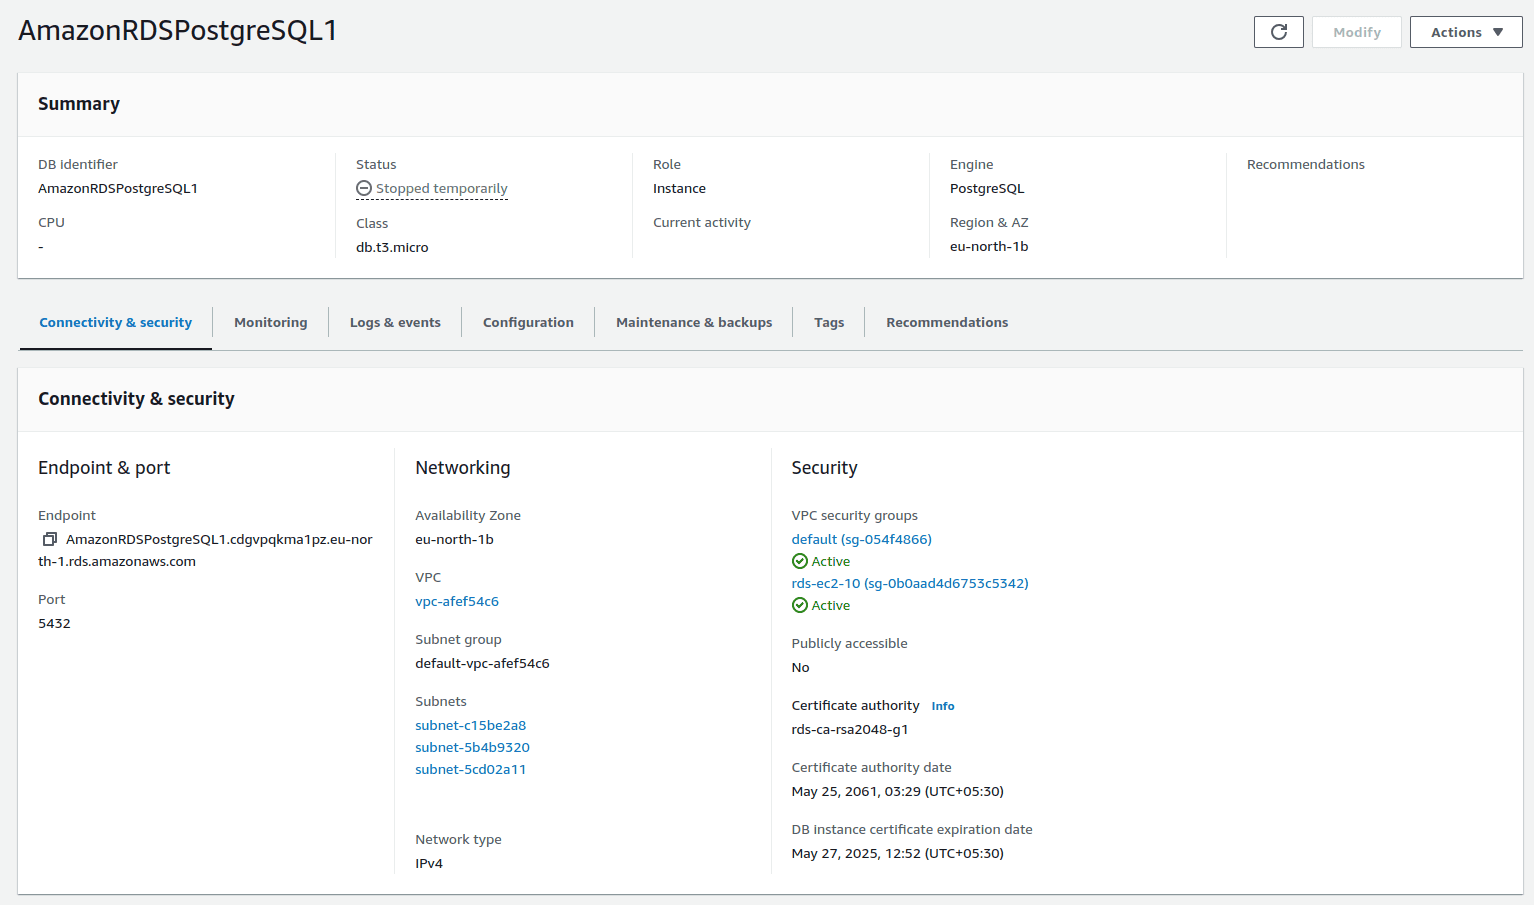
- You will find the Endpoint & port information under the Connectivity & security tab. We highly recommend using a private endpoint for adding a monitor.

Fig. 1. Endpoint & port within the AWS console. - Please make sure the endpoint is accessible via the EC2 instance. If there is no EC2 instance set up for connection, you can create one by clicking Set up EC2 connection under the Actions tab in the Connected compute resources section.

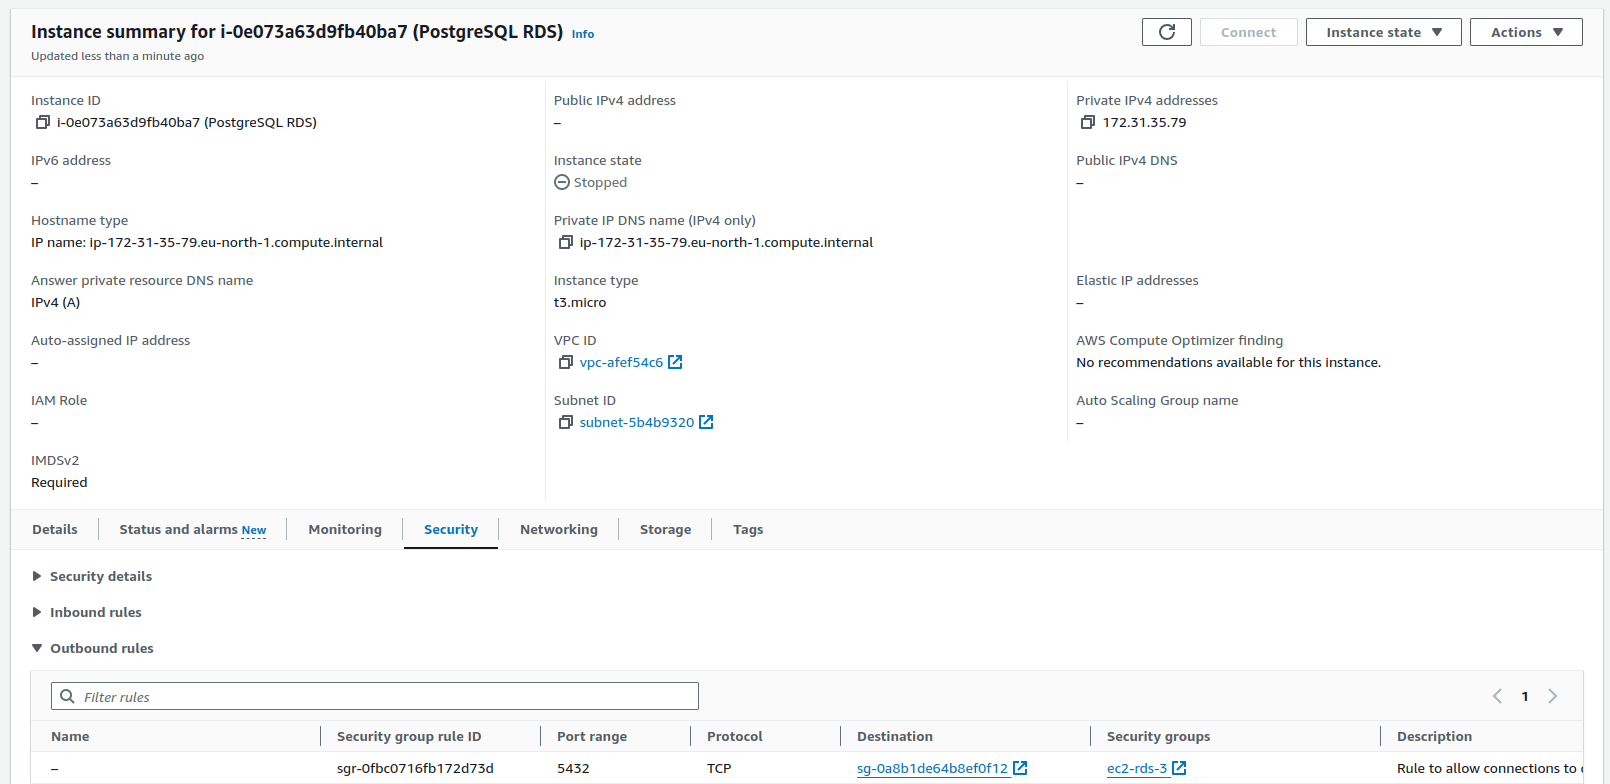
Fig. 2. Set up EC2 connection button. - If the endpoint is not accessible from the EC2 instance, check and update the outbound security rules of the EC2 instance and inbound VPC security group rules of the RDS instance to allow the PostgreSQL port.

Fig. 3. Outbound security rules of the EC2 instance.
Fig. 4. Inbound VPC security group rules of the RDS.
To monitor AWS RDS PostgreSQL or Aurora PostgreSQL, you need to install the Site24x7 Linux server monitoring agent in the EC2 instance that shares the VPC of the database.
Site24x7 server monitoring agent installation:
- Follow the steps on this page to create a user and grant permissions in the RDS instance.
- Download and install the Site24x7 Linux server monitoring agent using these steps.
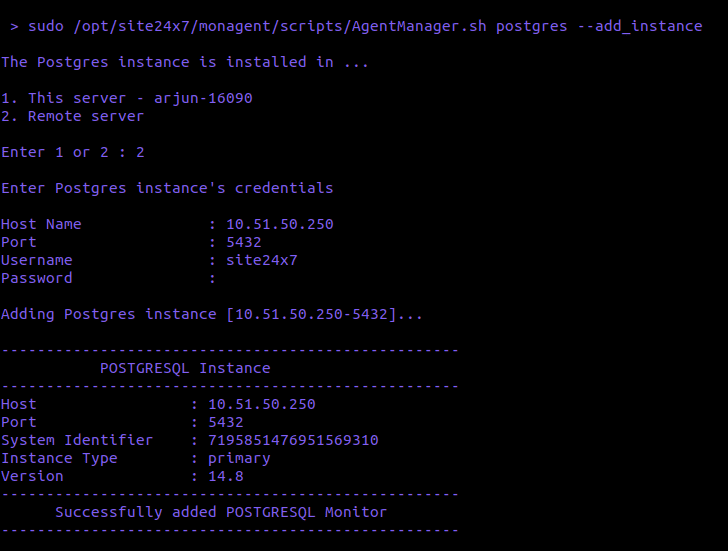
- To start PostgreSQL monitoring, authenticate Site24x7 to collect metrics. Execute the following command in your terminal to authenticate and configure PostgreSQL monitoring:
/opt/site24x7/monagent/scripts/AgentManager.sh postgres --add_instance - Enter your PostgreSQL instance's user credentials, including the host name, port of the PostgreSQL instance to be monitored, and the username and password that were created in step one, for the Site24x7 server monitoring agent.

Fig. 5. Adding the PostgreSQL instance. - For the host name and port, provide the private endpoint and the port number that you have copied from the Connectivity & security tab of the RDS instance (step four under Prerequisites).
To view the added PostgreSQL monitors, navigate to your Site24x7 account > Database > PostgreSQL > Your instances.
Amazon RDS for PostgreSQL monitoring using lambda functions is currently not supported.
To know more about the PostgreSQL performance metrics that can be tracked, setting thresholds, and getting alerts, check out the Site24x7 PostgreSQL monitoring help page.
Related links
Database monitoring: PostgreSQL | Amazon RDS for MySQL and Aurora MySQL | MySQL
Server monitoring: Linux
