Outlier Analysis for Capacity Planning Monitors
Outlier detection in capacity planning identifies the resources that show unusual behaviour compared to the rest of the resources with respect to performance. Outliers are observations in applications that occur due to the variation in the distribution of workloads or any failures in resources.
Use case
Consider there are 10 servers, among which eight servers' CPU utilization lies between 50-60%. But server nine's CPU utilization is 95% and server 10's CPU utilization is 20%. In this scenario, there are two outliers identified: server nine with an outlier value higher than the baseline value and server 10 with an outlier value lower than the baseline value.
Benefits of Outlier Analysis
You can leverage the following benefits using the Outlier Analysis feature:
- Drill deep into the performance of your resources based on different metrics.
- Analyze the variations in your resources at different times of the day.
- Understand and act on issues, if any.
- Improve the quality of resource performance.
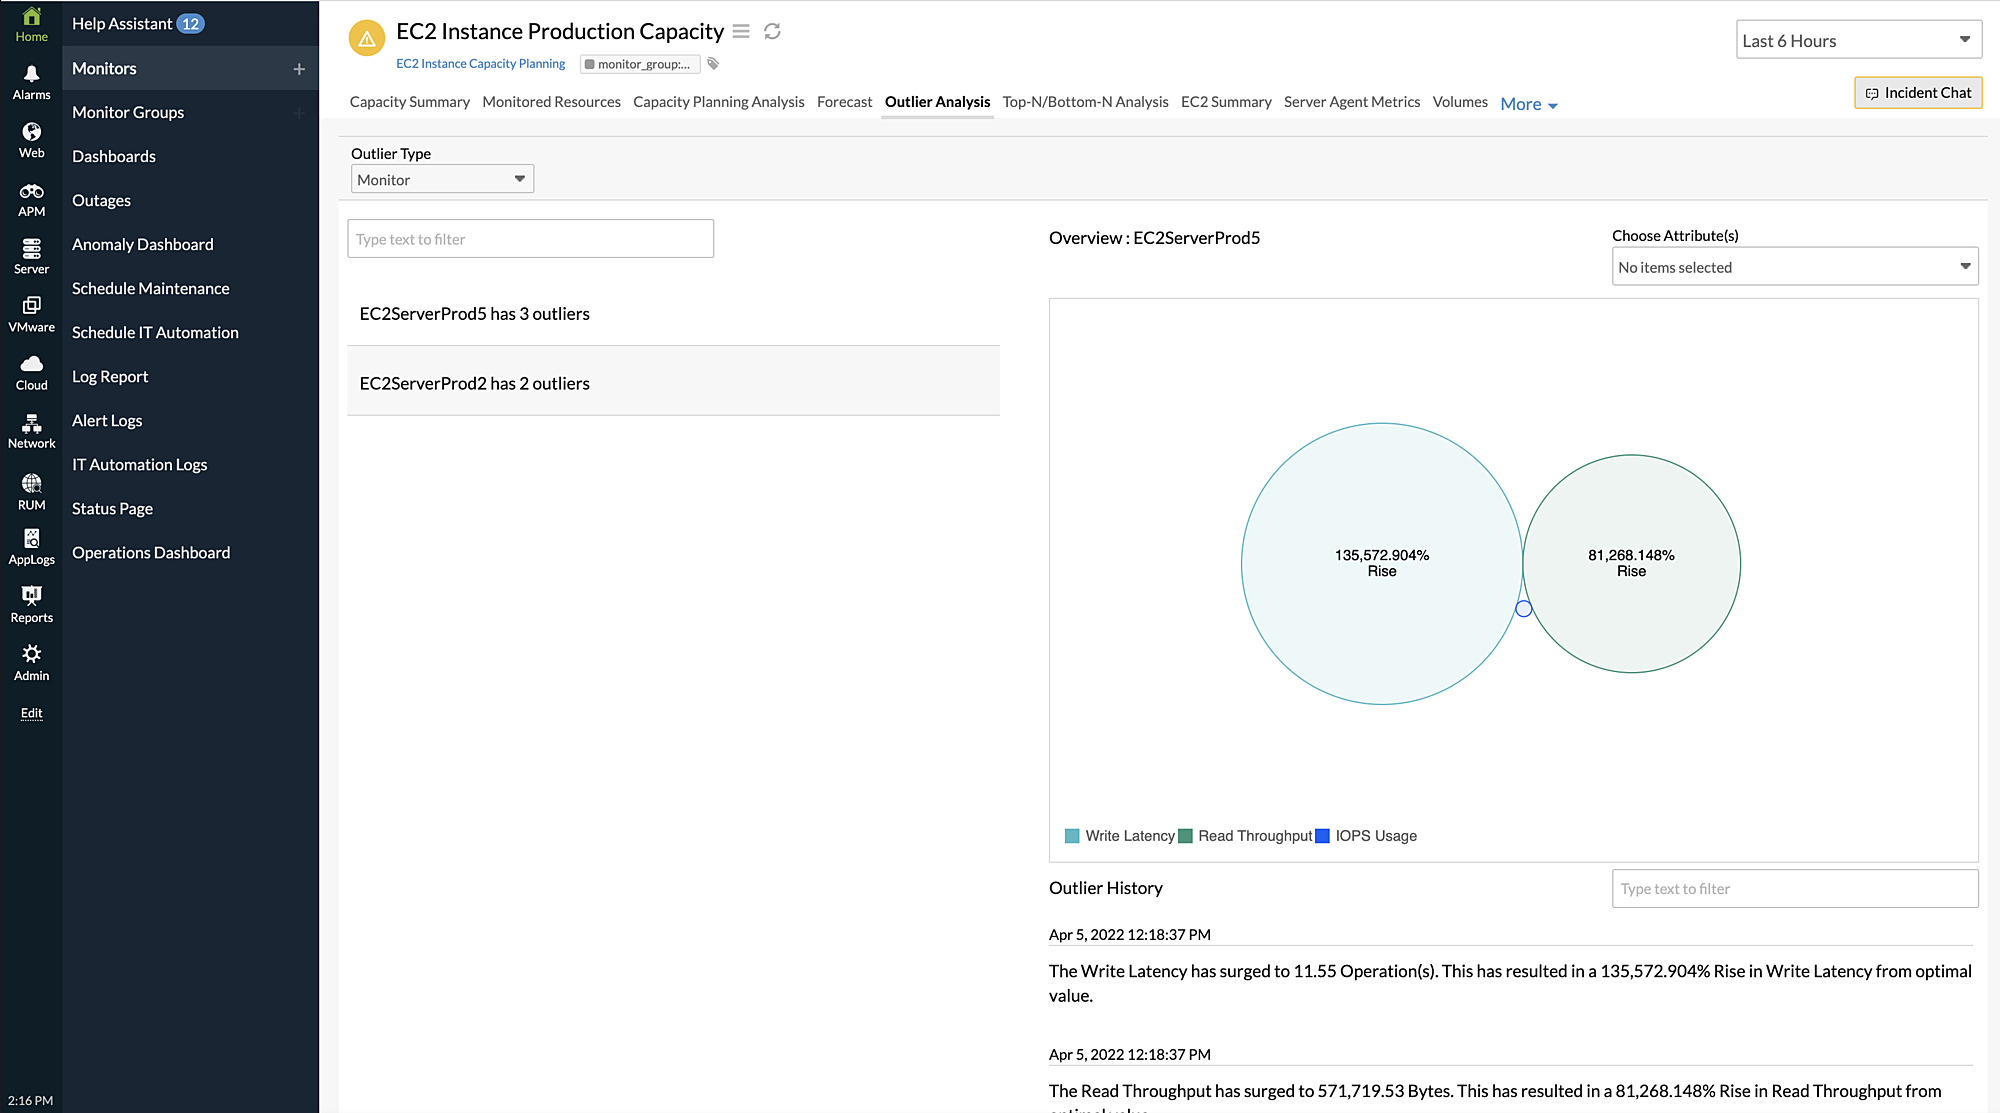
Monitor- or attribute-based outliers
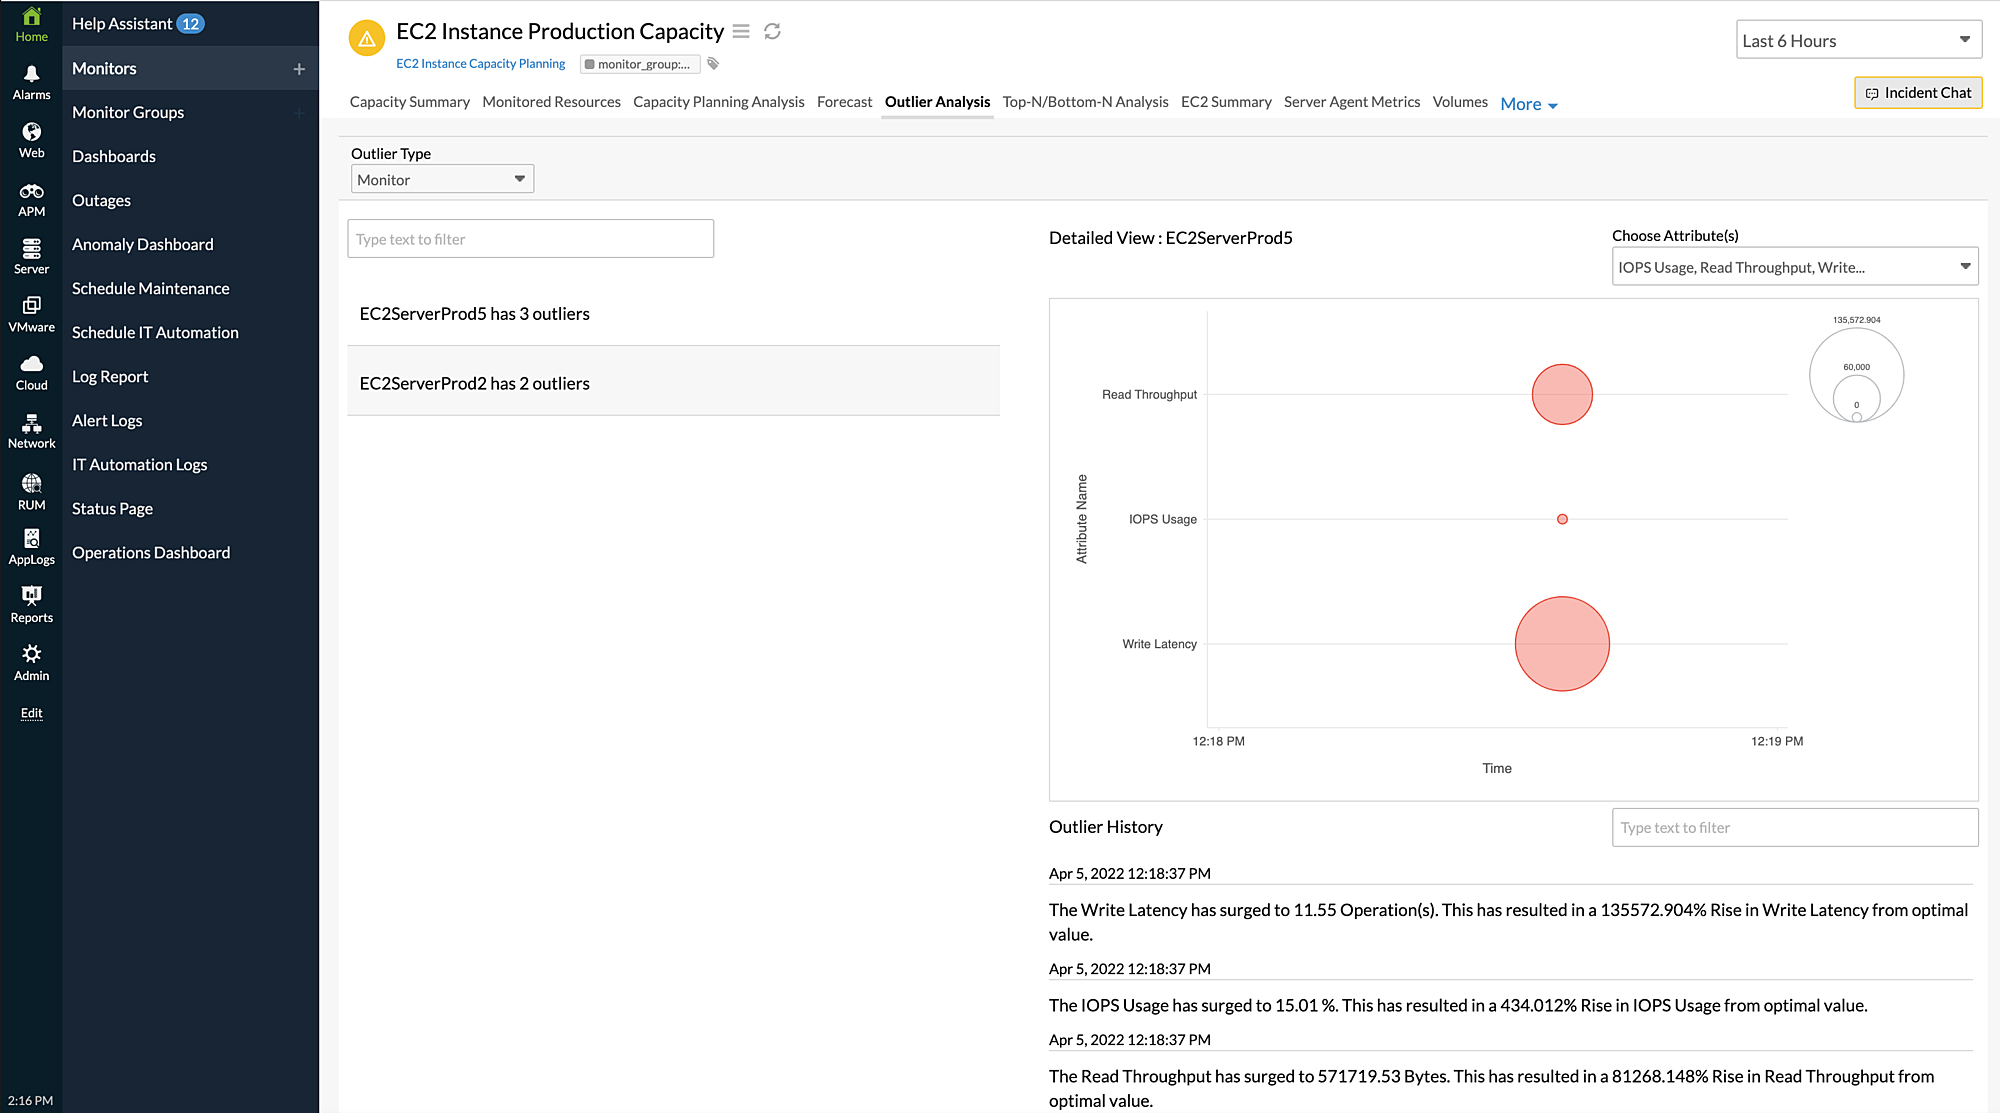
- Monitor: Determines the outlier based on the monitor. You can also select the required attribute for the monitor from the Choose Attribute field and see a detailed view of the attribute performance for that particular monitor.
For example, consider you have a load balancer monitor with three outliers and you want to view the latency attribute for the monitor. When you select the latency attribute from the Choose Attribute field, a detailed analysis of the latency attribute is displayed along with the outlier history. - Attribute: Determines the outlier based on the attribute. You can also select the required monitor for the attribute from the Choose Monitor field and see a detailed view of the monitor performance for that particular attribute.
For example, consider you have a CPU Credit Usage attribute with three outliers and you want to view the specific EC2 Instance monitor performance. When you select EC2 Instance from the Choose Monitor field, a detailed analysis of the monitor performance is displayed along with the outlier history.

From the Order History section, you can view the outlier analysis and see what caused the rise or fall in the performance of a monitor or attribute.
Viewing the Outlier Analysis
Select the outlier based on monitor or attribute and choose your required outlier from the list of outliers on the left side of the page. You can then view the detailed Outlier Analysis by selecting an attribute or monitor from the Choose Attribute or Choose Monitor fields.

