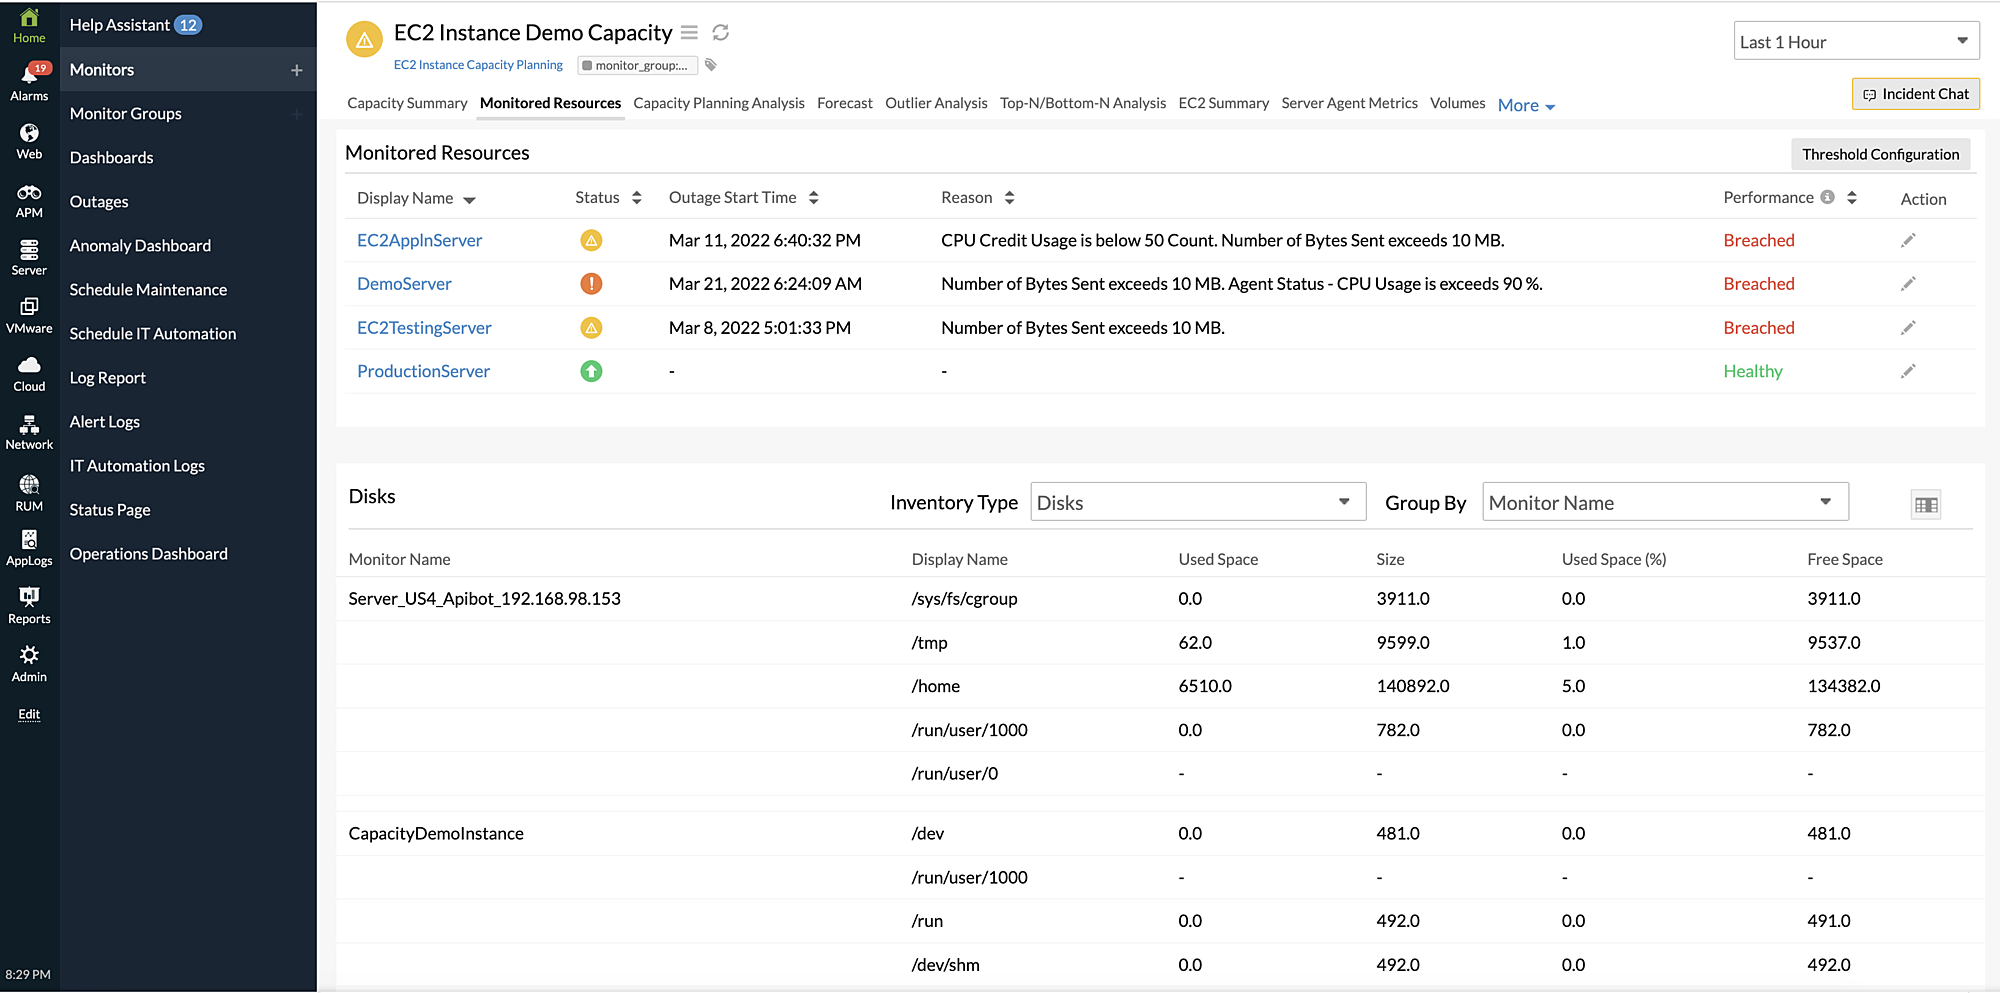
Monitored Resources for Capacity Planning Monitors
In the Monitored Resources section, you can view:
- The list of all resources mapped under the respective Capacity Planning monitor along with their status, outage time, and the reason for the outage.
- The performance status of monitors based on the thresholds provided at the capacity level.
Use case
Let's consider you have configured to receive alerts if the capacity planning threshold for CPU utilization exceeds 90%. If any individual monitor's CPU exceeds 90%, that monitor's performance status will be marked as Breached. You can also set alerts for this performance status to reduce multiple alerts and manage performance of mapped resources under a single monitor.
Threshold configuration for the monitored resources
To configure threshold limits for monitored resources, click the edit icon ![]() under Action. You can toggle to Yes or No for the following options:
under Action. You can toggle to Yes or No for the following options:
- Notify as Trouble when a Monitored Resource is Down/Trouble/Critical.
- Notify for a Performance Threshold Breach.

Viewing inventory data of the monitored resources
You can view the inventory data of resources like volume, CPUs, disks, and network from the latter half of the Monitored Resources tab. This allows you to set filters based on resources depending on the monitor type. In addition, the Group By filter allows you to group your monitor name and other configuration details and obtain a consolidated list of metrics. To choose the columns that you'd like to view, click the table icon.
For example, if you've selected Disk as the Inventory Type, you can view all the monitored EC2 instances and their corresponding disk-related metadata and configuration information organized in columns. You can also use the Group By filter to group the listing based on Used Space, Size, Free Space, or others.
