Capacity Summary for Capacity Planning Monitors
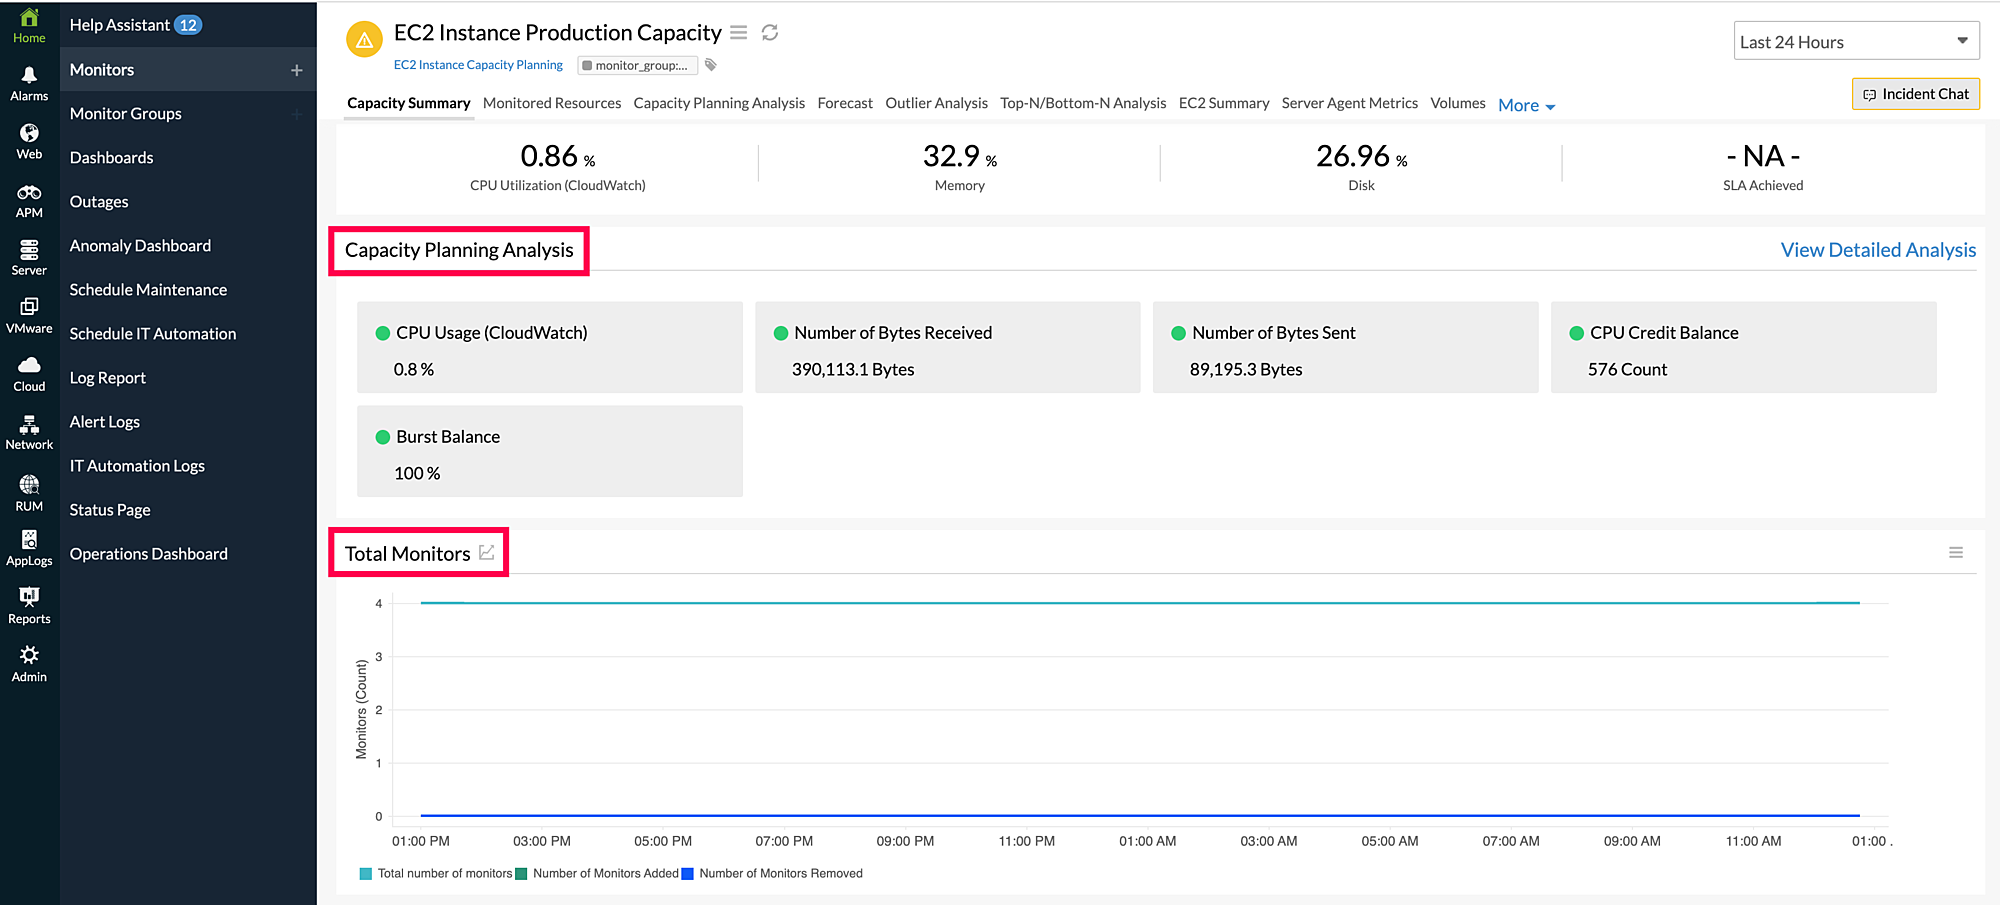
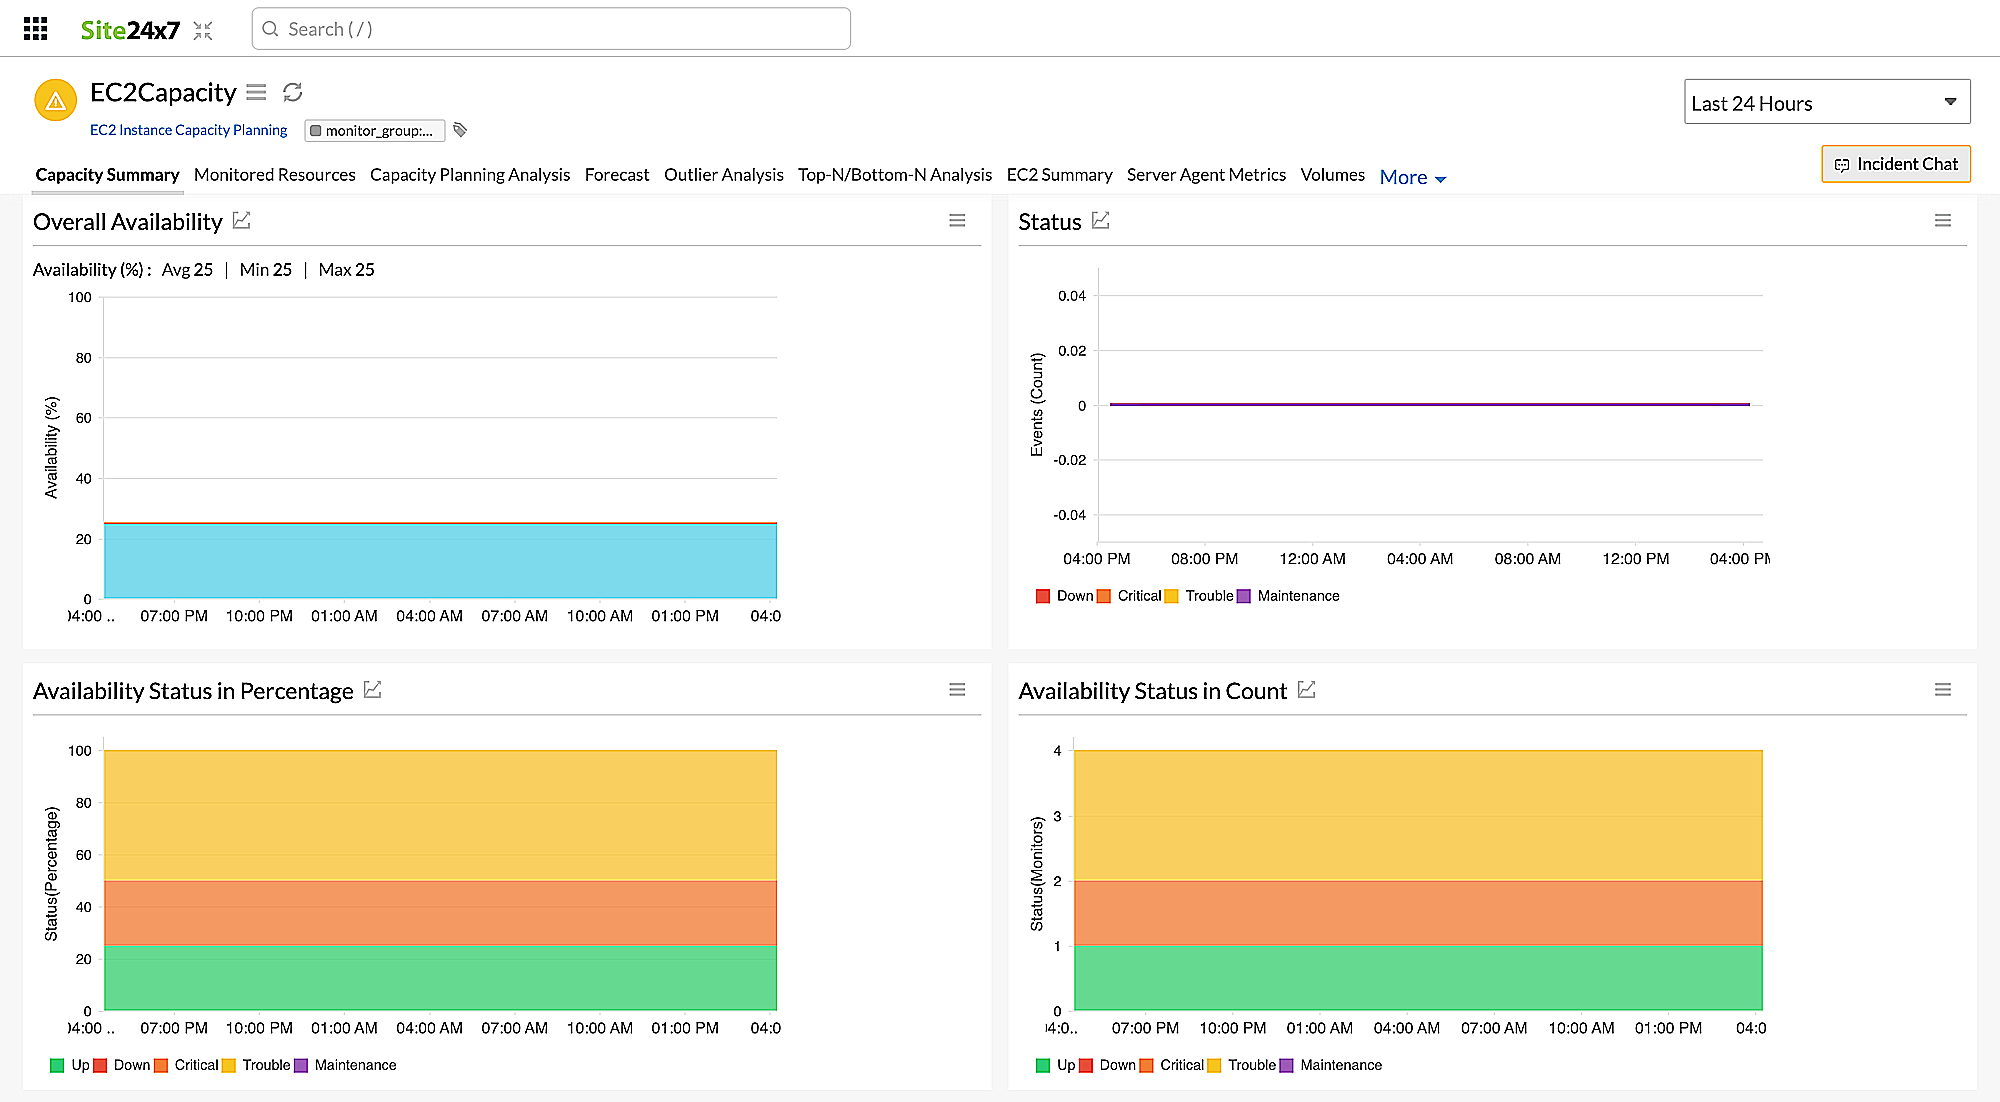
The Capacity Summary tab displays overall details about Capacity Planning Analysis, Total Monitors, Overall Availability, and Total Downtime. To access this tab:
- Go to Home > Monitor Groups.
- Click the monitor group of your preference.
- Select the desired monitor name.
- Click Capacity Summary.
Capacity Planning Analysis
The Capacity Planning Analysis section displays an overview of the capacity usage metrics at the capacity planning level. These metrics depend on the monitor type selected for capacity planning. Click View Detailed Analysis for more insights.
For instance, the default metrics for an EC2 monitor include CPU Usage, Number of Bytes Received, Number of Bytes Sent, CPU Credit Balance, and Burst Balance. If required, you can also give manual values to analyze the capacity in the threshold profile. Learn more.

Total Monitors
The Total Monitors section displays the Total number of monitors, Number of Monitors Added, and Number of Monitors Removed from the Capacity Planning entity.

Overall Availability
The Overall Availability section includes the availability of the Capacity Planning monitors, events based on status, and Availability Status in Percentage/Count of the monitors attached. The various statuses in the section include Up, Down, Critical, Trouble, and Maintenance.

Total Downtime
The Total Downtime section displays the downtime of the monitors grouped in Capacity Planning. This includes total, average, maximum, and minimum downtime among the monitors.
