Azure Dashboards
The Site24x7 Azure monitoring tool enables you to monitor your Azure resources and gain insight into your Azure environment using exclusive dashboards. You can also create custom dashboards and detect critical anomalies beforehand using the Anomaly Dashboard.
Service View:
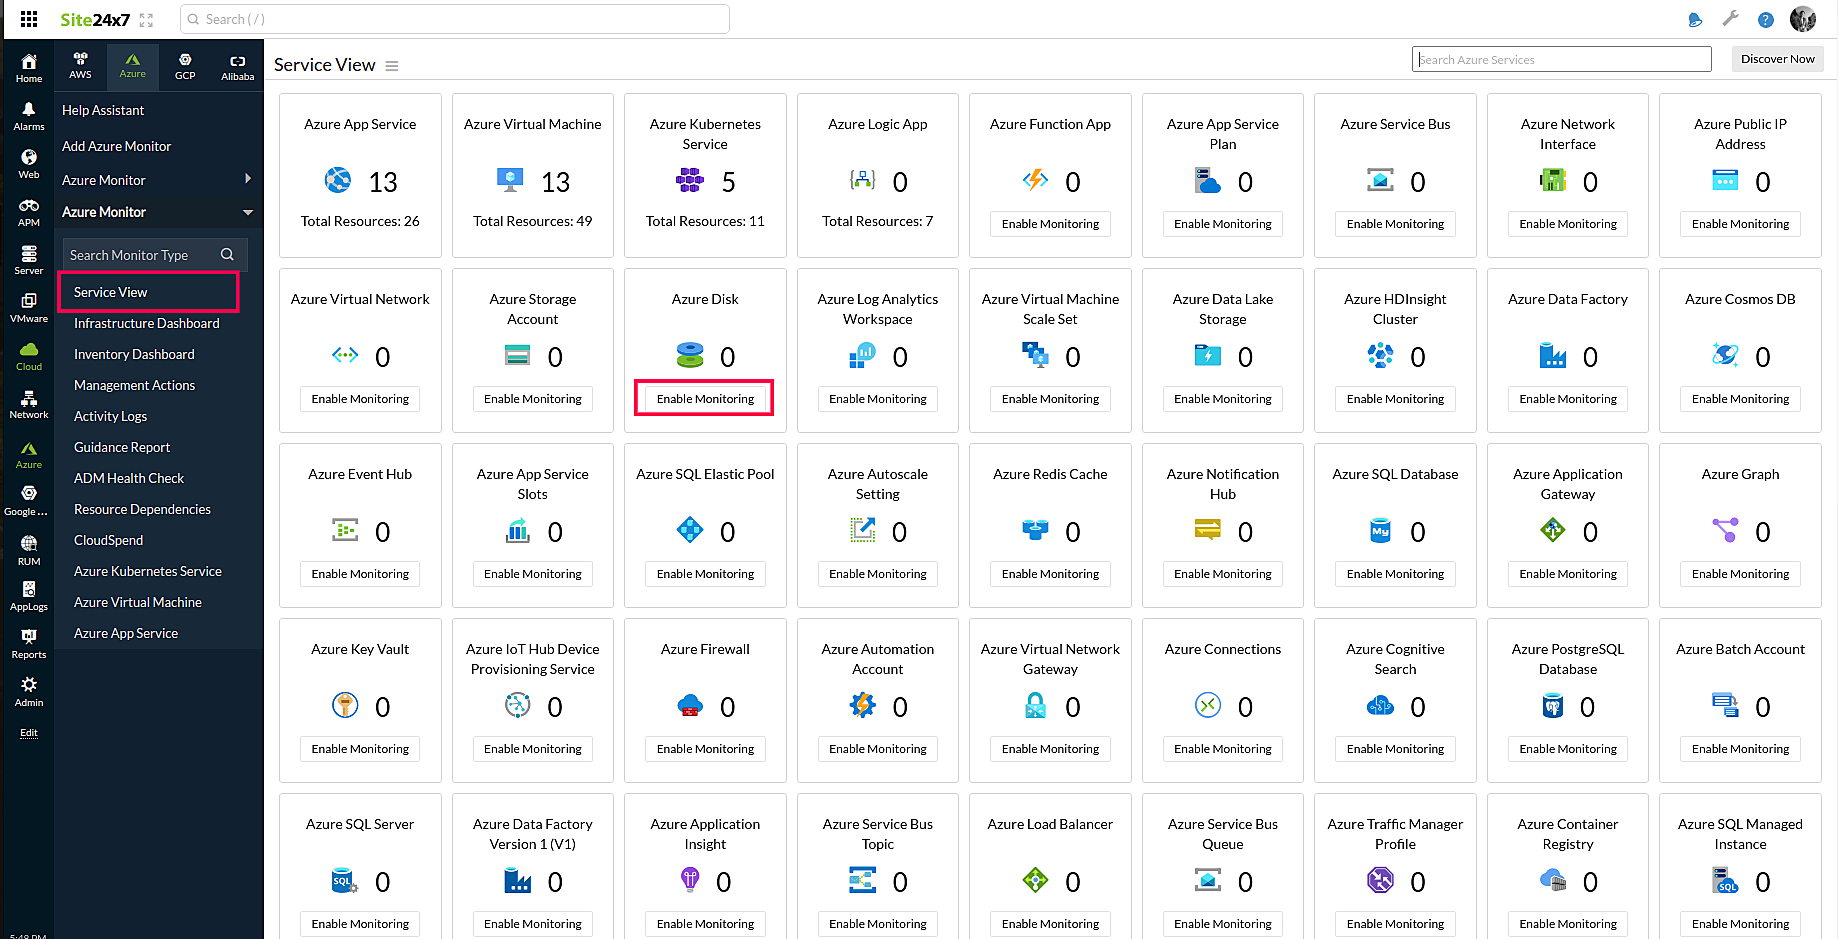
Using the Service View, you can see a list of the Azure services supported by Site24x7. This view shows the count of active resources monitored under each resource type in Site24x7. To get to the Service View of your Azure resources, go to Azure > Service View.
If the resource type is selected for monitoring in Site24x7, you can see the total number of resources in your Azure portal. Otherwise, you'll see the Enable Monitoring button.
You can instantly add a particular resource type for monitoring by clicking Enable Monitoring. Once the resource type is enabled, the resources will be added for monitoring in the upcoming discovery.
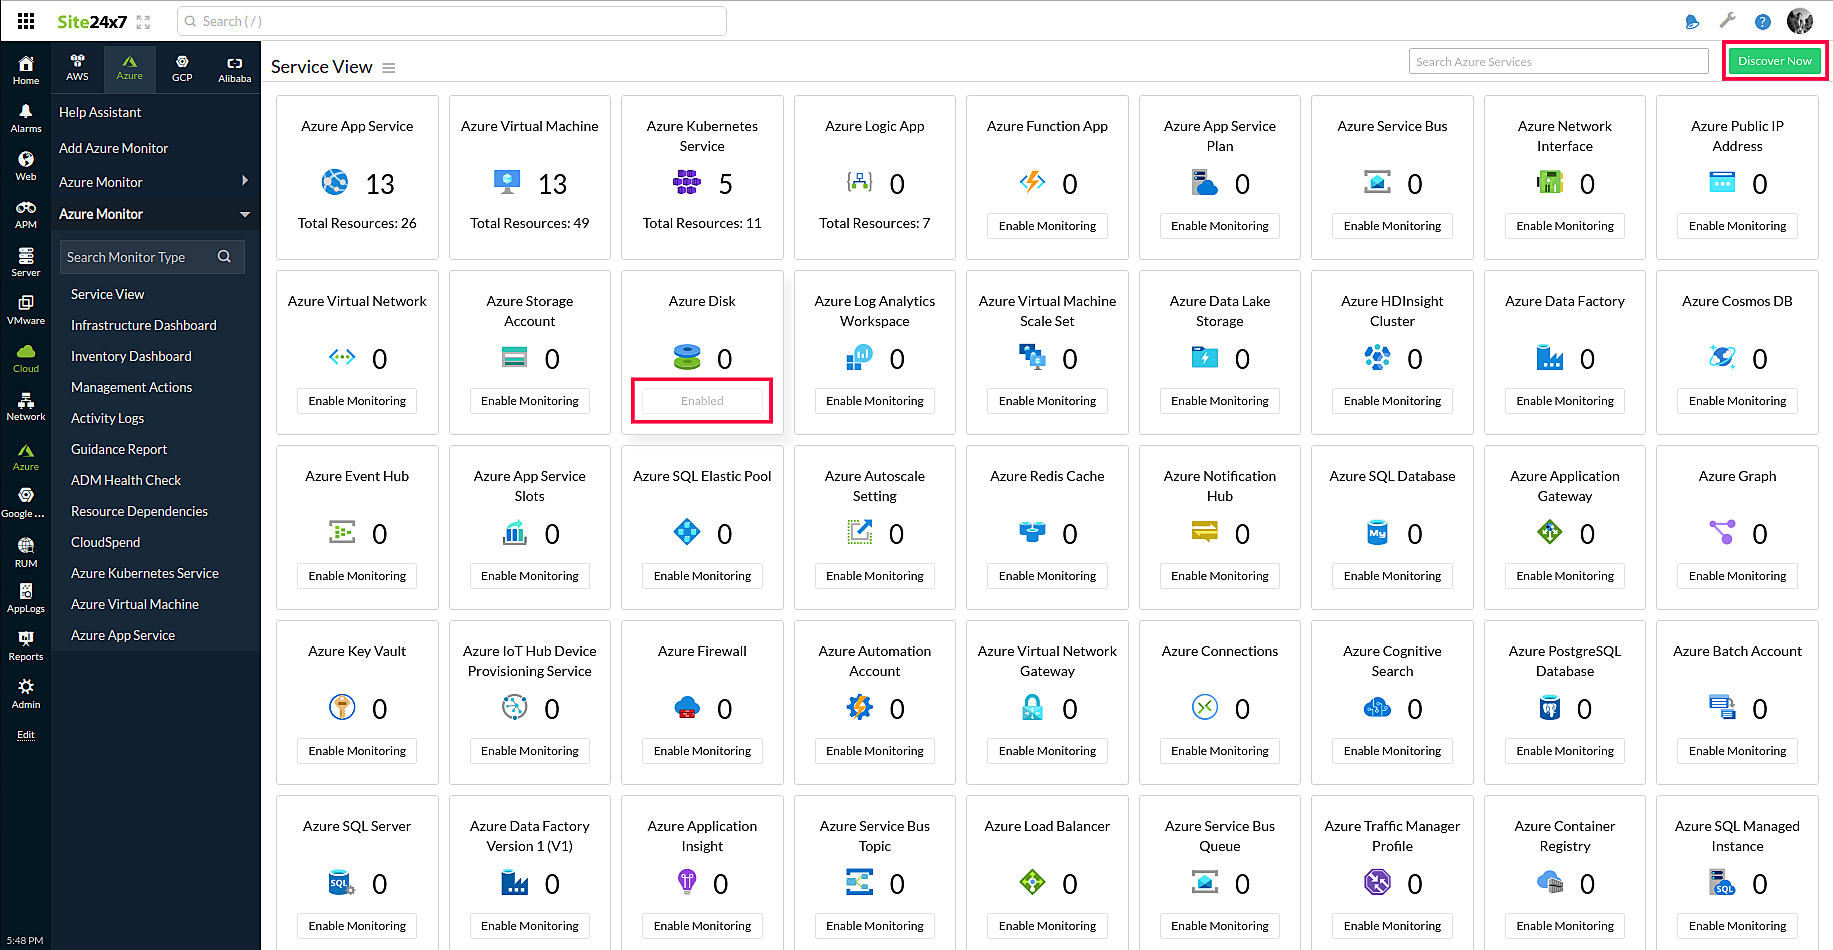
You can also trigger discovery manually by clicking the Discover Now button. Hover over the hamburger icon beside the page title to Edit, Suspend, or Delete the Azure monitor or to discover resources immediately.
Infrastructure Dashboard:
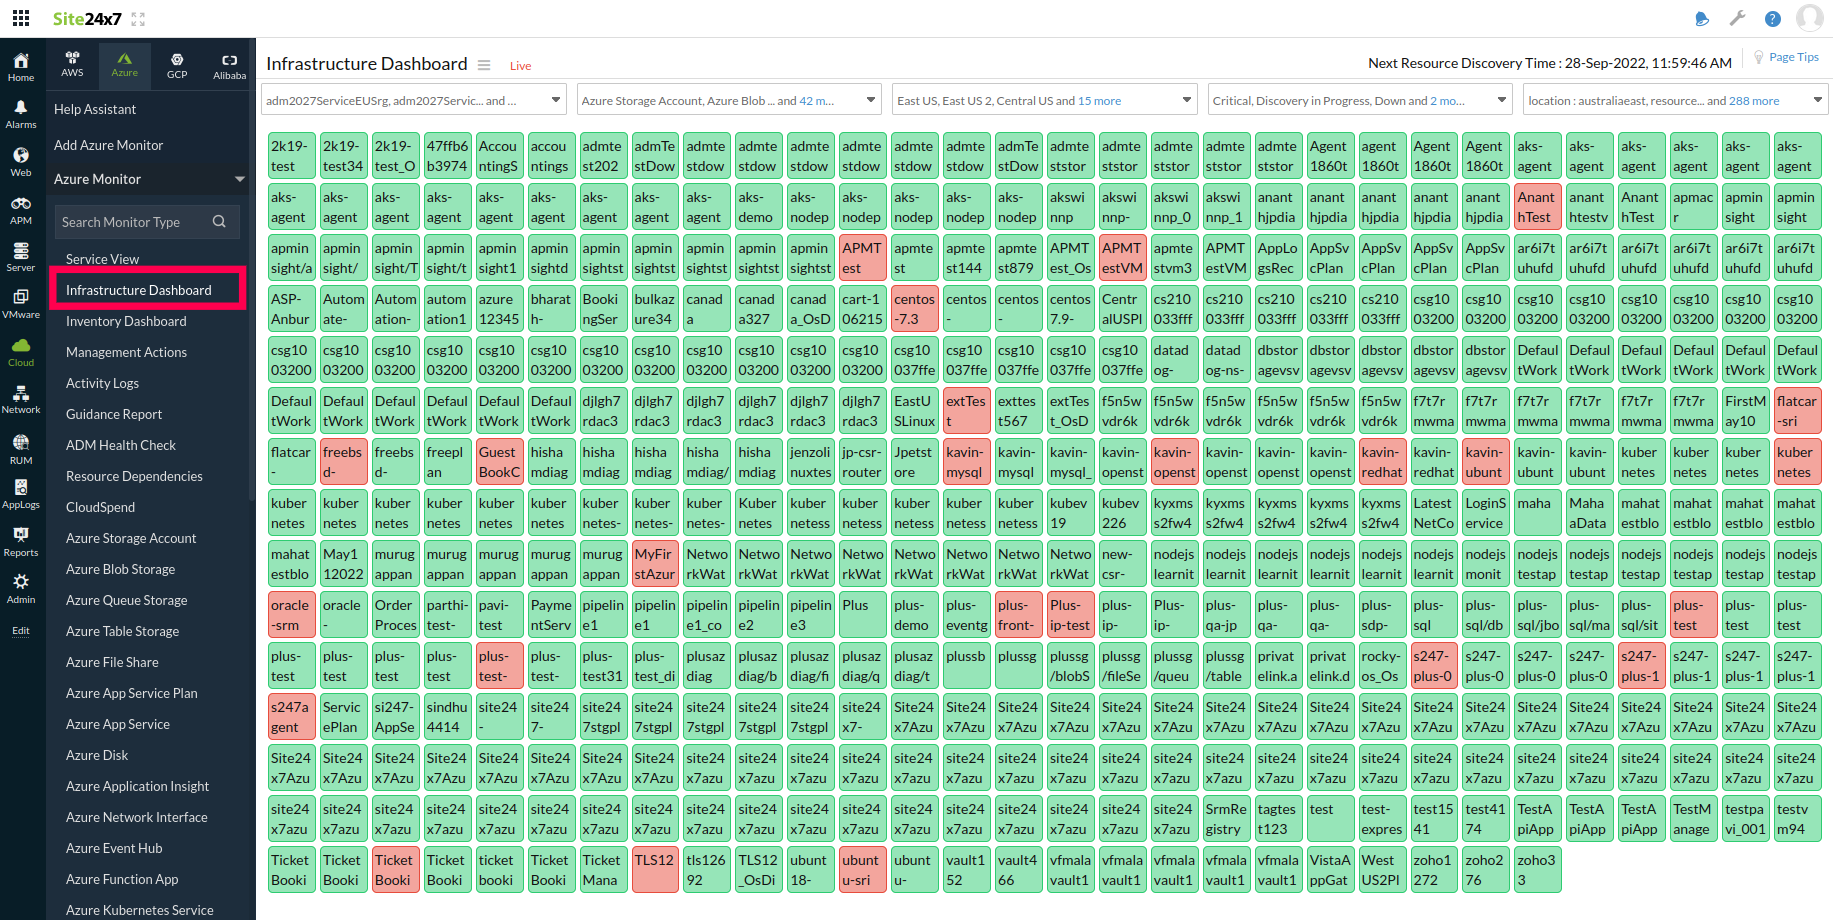
Once you've successfully added an Azure monitor, you'll be directed to the Infrastructure Dashboard. You can also access it by going to Azure > Infrastructure Dashboard. This represents a NOC view of all the Azure resources discovered in your account. You can Edit, Suspend, or Delete the Azure monitor and discover resources immediately by hovering over the hamburger icon beside the page title.
Highlights:
- View all the Azure resources on a single dashboard.
- View resources according to their status: Up, Down, Trouble, Critical, or Suspended.
- Filter resources based on their names, resource groups, resource type, locations, tags, subscriptions, and status.
- Click a NOC box to go to that particular monitor's Summary page.
Inventory Dashboard:
Like the Infrastructure Dashboard, the Inventory Dashboard gives you a view of the Azure resources discovered from your account. To get to the Inventory Dashboard, go to Azure > Inventory Dashboard.
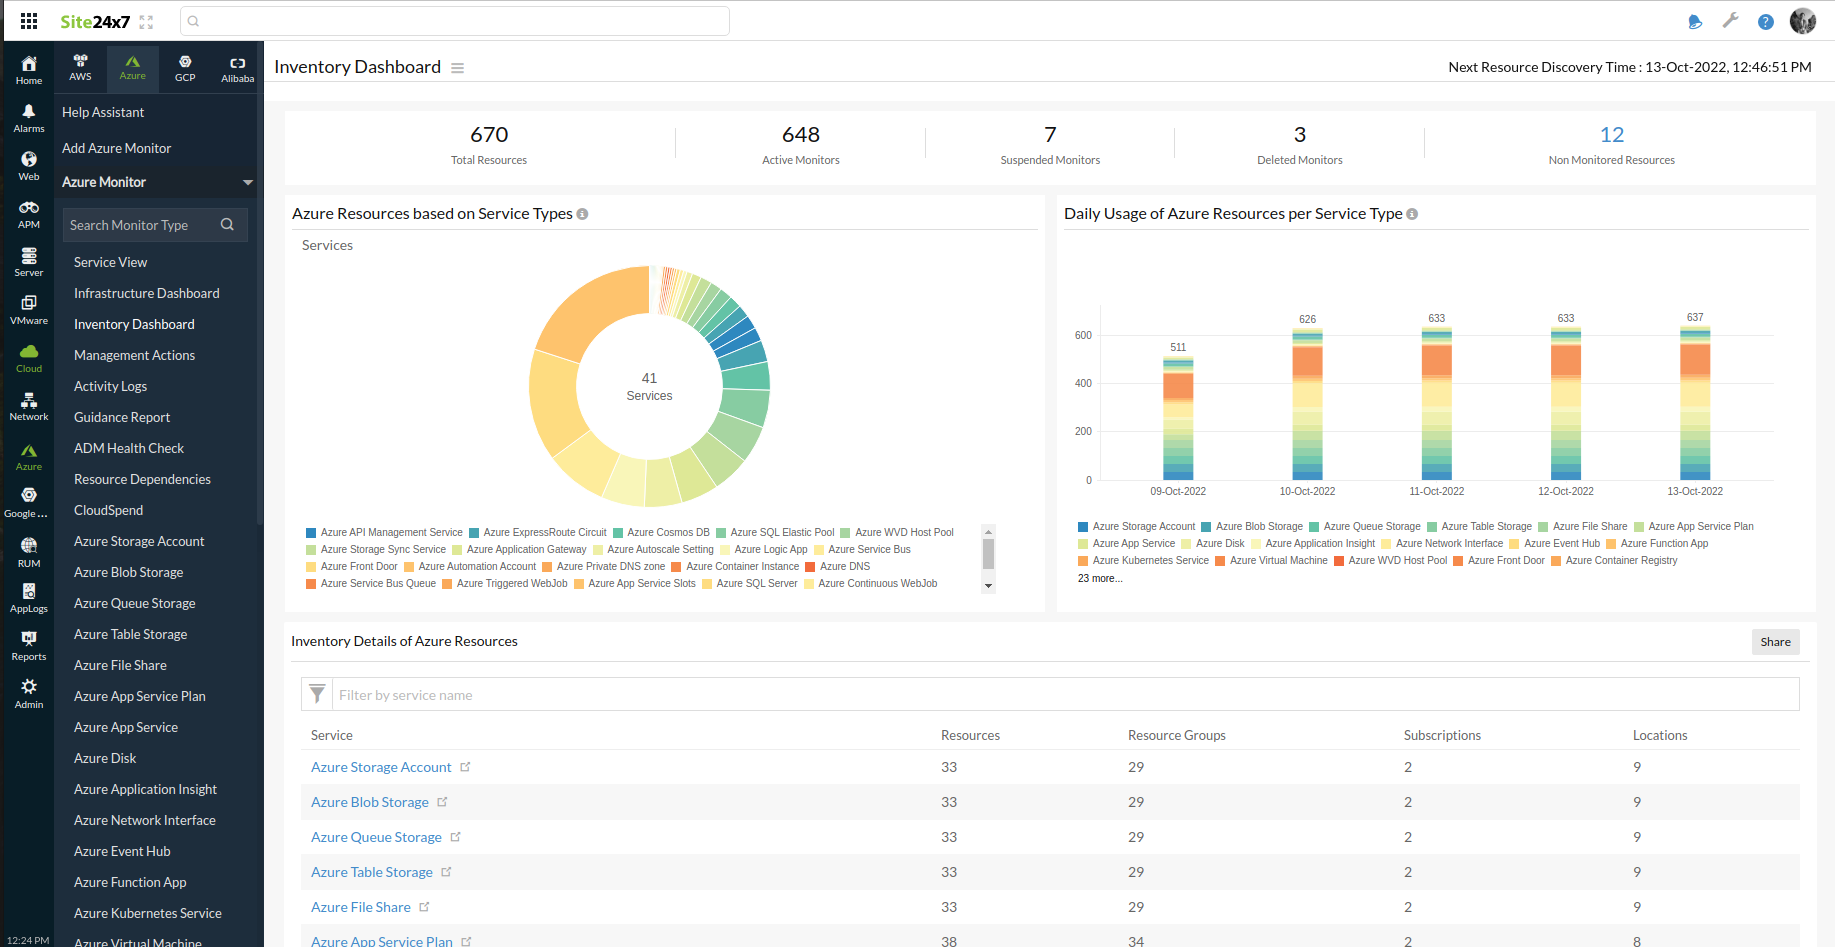
Highlights:
- View all discovered Azure resources broken down by their respective resource type in a single pie chart. Hover over a section in the chart to get the resource count under a particular resource type.
- View the daily usage of critical resources for all resource types.
- Under Inventory Details of Azure Resources, get a tabular view of all your Azure resource types, along with their respective number of locations, subscriptions, resources, and resource groups. You can filter out resource types based on locations, resources, and resource groups. You can also use the Share button to export the details as a PDF, a CSV, or as an email notification.
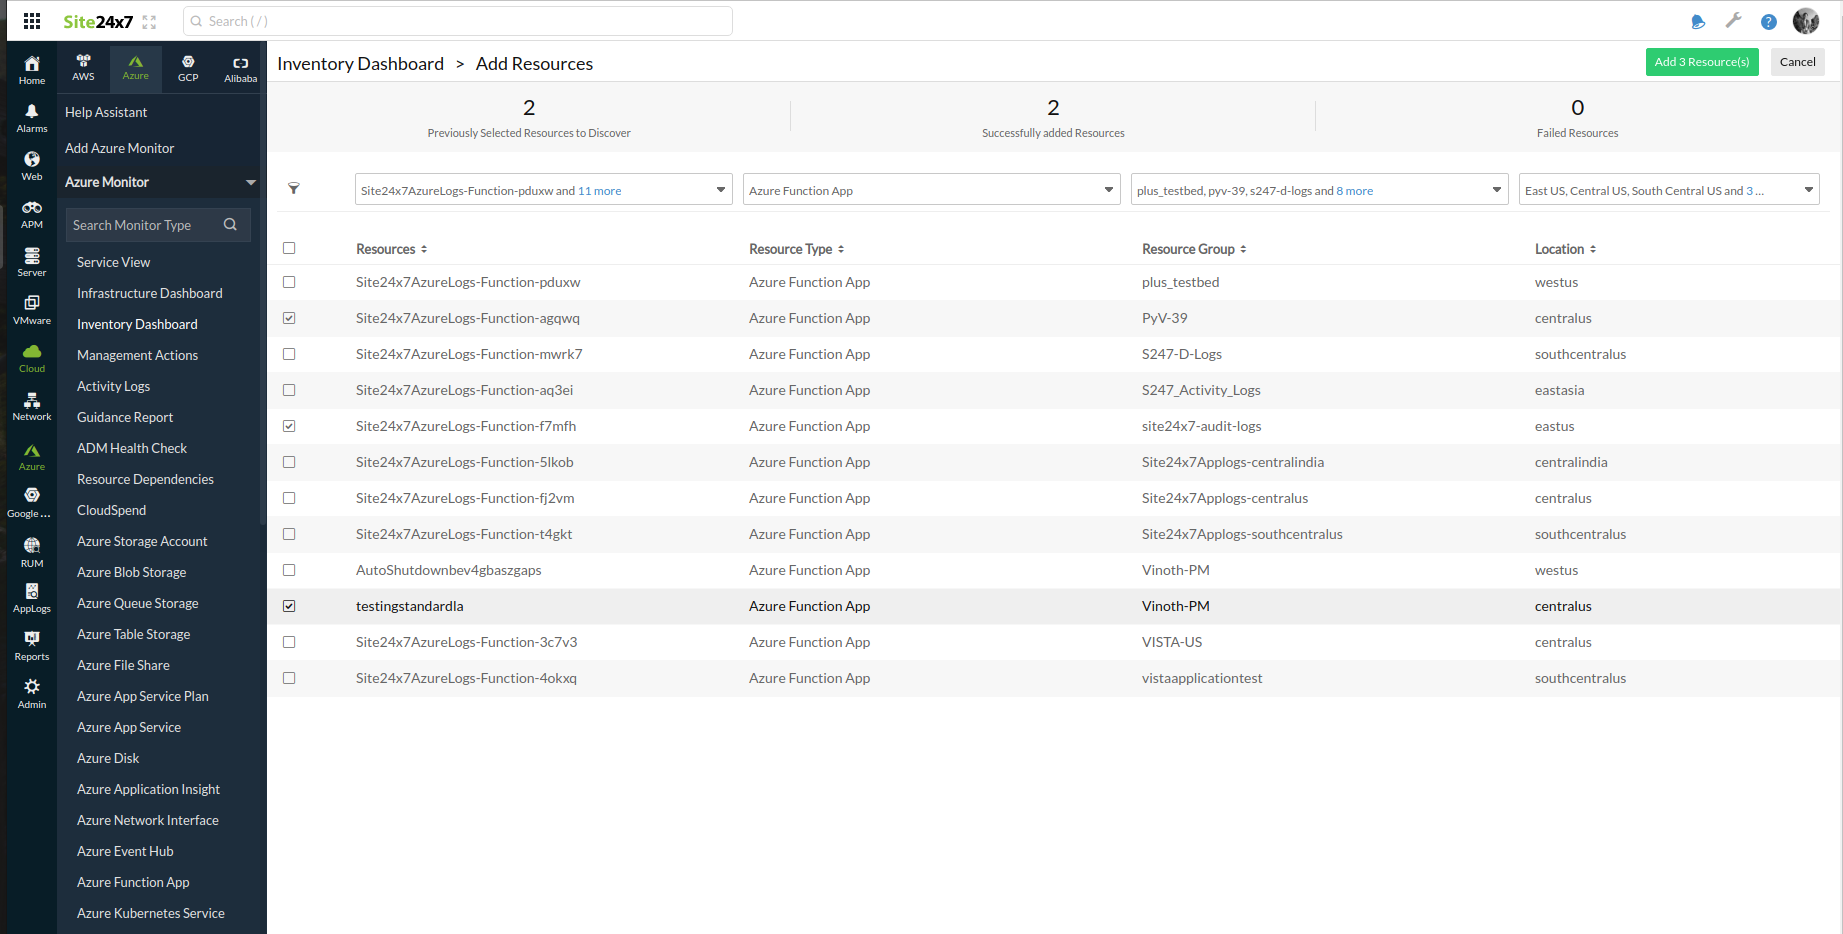
- View the total number of resources in your Azure account, as well as Active Monitors, Deleted Monitors, and Suspended Monitors, in Site24x7. The resources which are not monitored by Site24x7 will be listed under Non-Monitored Resources. On clicking it, you can select the required resources and add them for monitoring irrespective of the configurations that you have made under the Edit Azure Monitor page. You can also filter the non-monitored resources list based on the name of the resource, the resource group, the resource type, and location.
Zia Anomaly Dashboard
Site24x7's Azure monitoring tool is AI-powered and helps detect any unusual spikes or aberrations in your resource's critical performance attributes. This fine-tunes your resource performance and safeguards your Azure infrastructure from any unforeseen issues. To view the anomaly dashboard for Azure:
- Log in to Site24x7 and go to Home > Anomaly Dashboard.
- Select a time span from the Time Period drop-down. You can search for your Azure monitor's anomalies by looking up the name(s) in the Search Bar or by filtering it out based on the various severity levels.
You can view the Anomaly Summary graph for the requested time period and the specific reason for each detected anomaly (listed under Anomaly History). To gather further insight on the root cause of performance issues, click Analyze Root Cause, which is provided along with the anomaly description (under Anomaly History).
Custom Dashboard:
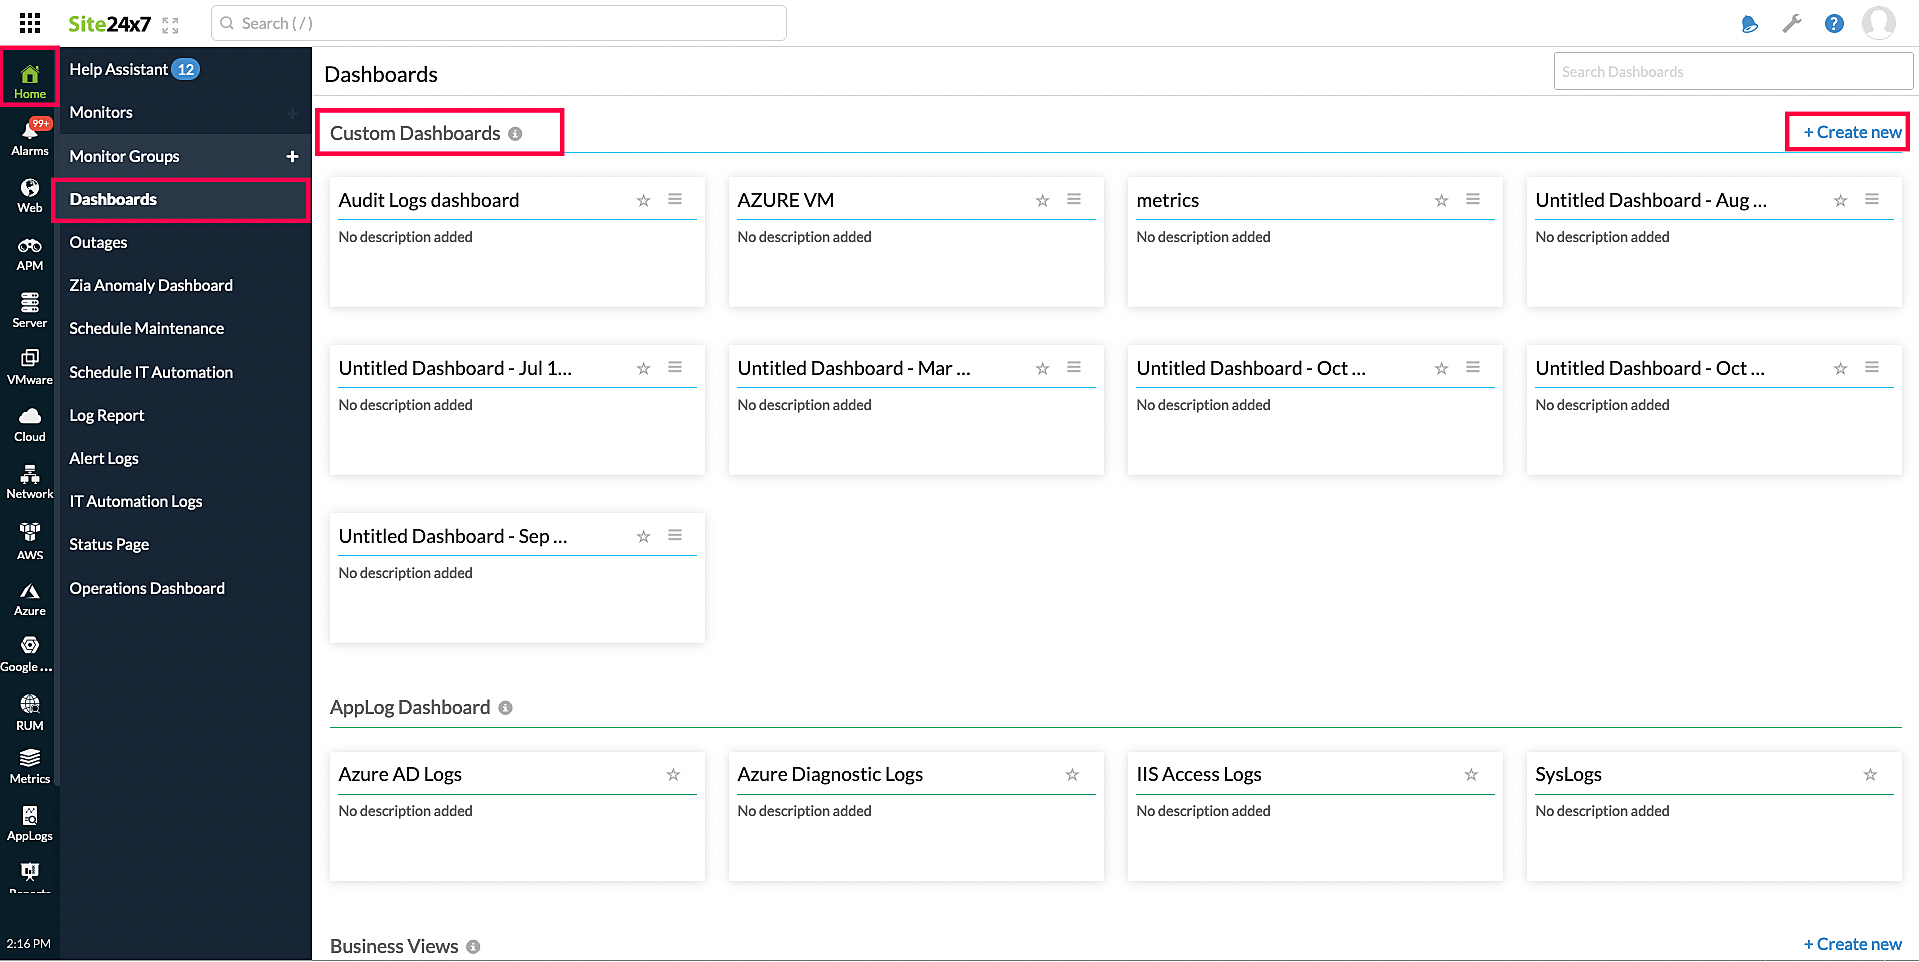
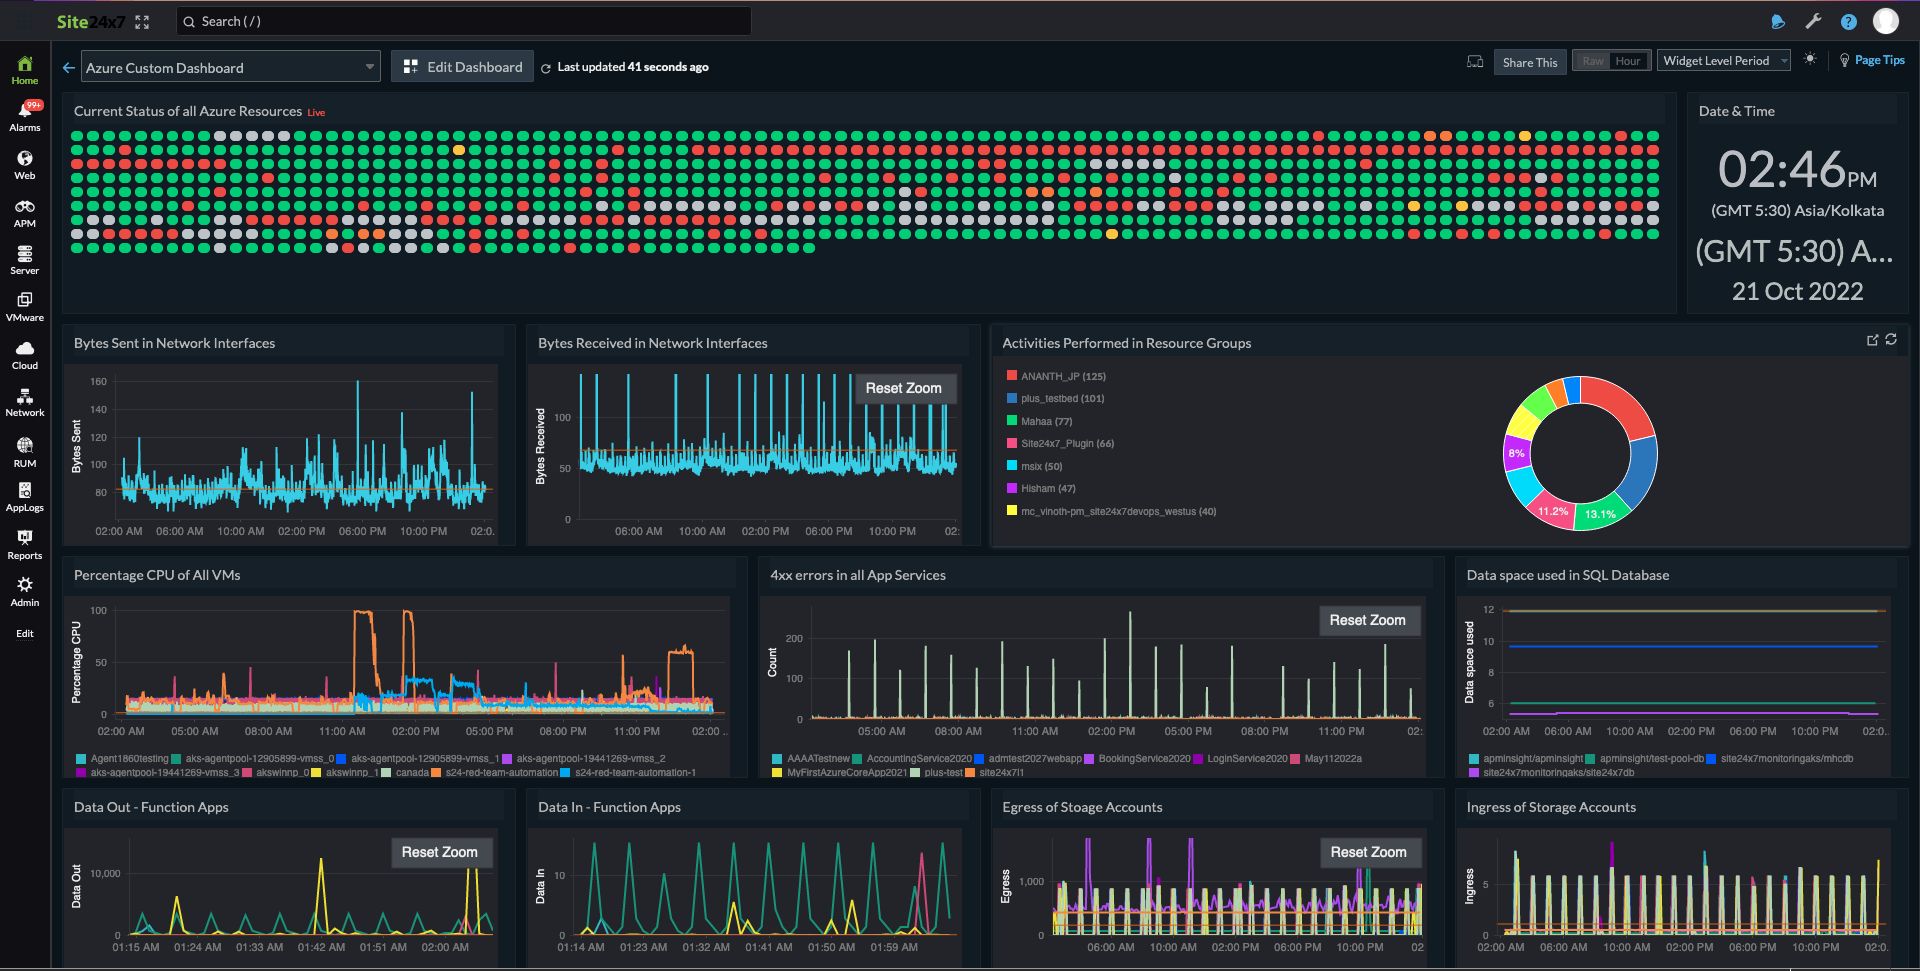
You can build your own dashboard that displays various key metrics across all your Azure resources. To start, navigate to Home > Dashboards > Custom Dashboards > + Create New.
- Provide a suitable name and description for your dashboard.
- Under Widget Category, choose from Performance Widgets, Top N Widgets, or Current Status Widgets.
- Select All Monitors under Filter Monitors by Monitor Group.
- Under Monitor Type, select the desired Azure resource type.
- Pick your Azure resources under Choose Monitors to create your dashboard.
- Select the required Time Period and drag and drop the widgets onto the working space.
- When you're done, click Done Customizing at the top of the page.
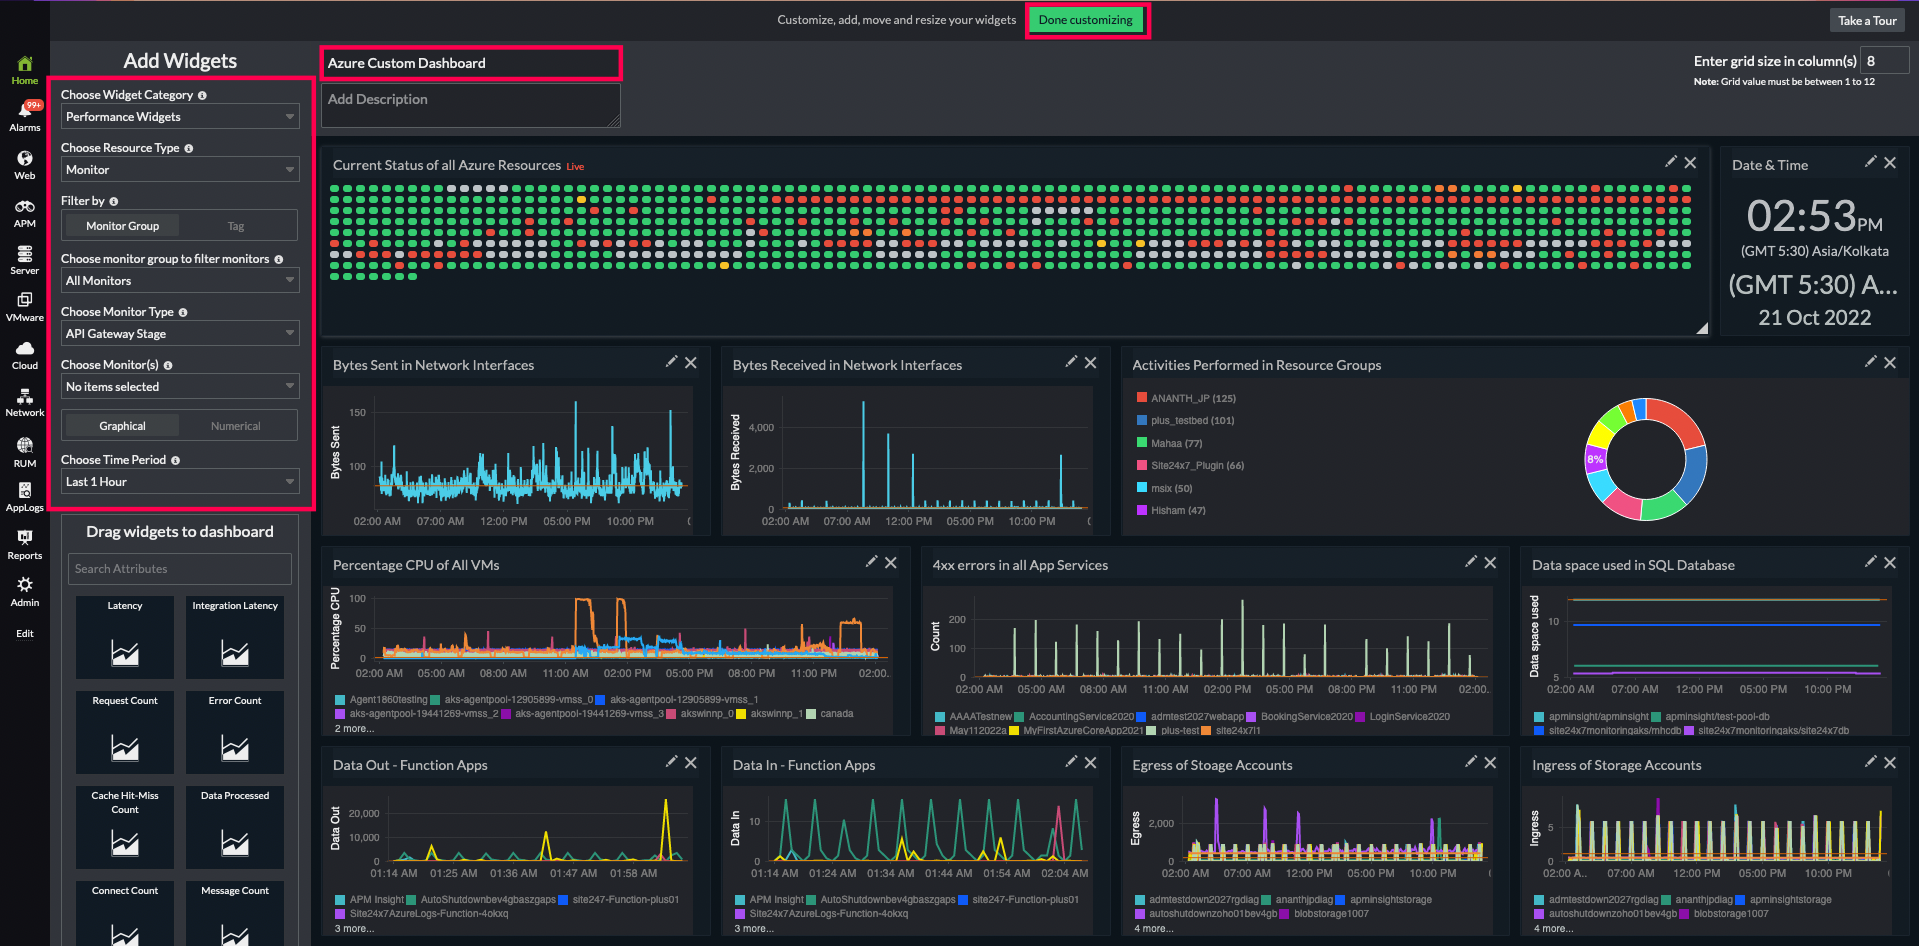
Customize your dashboards for convenience with multiple editing options as shown here:
Subscriptions tab
The Subscriptions tab displays all Azure subscriptions linked to your Site24x7 account. This is your primary view for monitoring subscription health, activity, and monitoring status across all your Azure accounts. Use this tab to verify which subscriptions are actively being monitored, confirm monitoring is enabled, and navigate to individual subscriptions for detailed management.
Subscriptions tab columns
| Column | Description |
|---|---|
| Subscription Name | The display name of the Azure subscription as it appears in your Azure account. This is a sortable field. Click the column header to sort alphabetically. |
| Account Name | The linked Site24x7 Azure account that owns this subscription. Multiple subscriptions can belong to the same account. This is a sortable field and displays as a hyperlink for quick navigation to account details. |
| Active Monitors | The total number of monitors currently active and monitoring resources within this subscription. Higher numbers indicate more comprehensive monitoring coverage. Click this number to view the list of active monitors for that subscription. This is a sortable field. |
| Enabled for Monitoring | Indicates whether monitoring is currently enabled (Yes) or disabled (No) for this subscription. Only enabled subscriptions will have their resources monitored by Site24x7. This is a sortable field. |
| Status | Reflects the operational status of the subscription connection. |
Accounts tab
The Accounts tab provides a summary view of all Azure accounts you have connected to Site24x7. This tab shows account-level aggregations and metadata, allowing you to monitor the health of your account integrations, track subscription distribution, and manage account credentials. Use this view to quickly assess the scope of monitoring across all your Azure accounts and identify accounts that may need credential renewal.
Accounts tab columns
| Column | Description |
|---|---|
| Account Name | The display name assigned to this Azure account in Site24x7. This is a sortable field and typically matches the name of your Azure tenant or subscription prefix. Click the account name to view detailed account information and configuration. |
| Total Subscriptions | The total number of Azure subscriptions associated with this account, regardless of monitoring status. This is a sortable field and shows the complete scope of subscriptions available through this account connection. |
| Active Subscriptions | The number of subscriptions within this account that are currently enabled for monitoring. This should typically equal or be close to Total Subscriptions if you want full coverage. This is a sortable field. |
| Active Monitors | The aggregate count of all monitors actively monitoring resources across all subscriptions in this account. A higher number indicates more comprehensive coverage. This is a sortable field and provides a quick measure of monitoring depth. |
| Created Time | The date and time when this Azure account was first connected to Site24x7 (format: DD/Mon/YYYY HH:MM:SS). This is a sortable field and helps track when the integration was established. Accounts created long ago may have outdated credentials. |
| Secret Expiry | The date when the account's authentication credentials (service principal secret or certificate) will expire (format: YYYY-MM-DD). This is a critical field—accounts approaching expiry will stop monitoring after the credential expires. Renew credentials before this date to prevent monitoring disruption. This is a sortable field, making it easy to identify accounts nearing expiration. |
Monitor the Secret Expiry column closely. Azure service principal secrets typically expire after six months. Our default Threshold Profile alerts you to renew credentials at least 30 days before expiry to avoid monitoring interruptions.
Resource Inventory tab
The Resource Inventory tab shows all Azure resources discovered across your subscriptions. This tab provides a quick inventory view of your infrastructure with sorting and filtering capabilities. For a detailed guide on the Resource Inventory dashboard, including advanced filtering, resource discovery, resource grouping, and orphaned resource identification, refer to the Azure Resource Inventory dashboard help document.
Topology view
Navigate to: Cloud > Azure > required Azure monitor > Topology View. Visualize the hierarchical structure and relationships between your Azure resources. This view displays your cloud infrastructure as an interactive topology map, showing how subscriptions, resource groups, and individual resources are connected and nested. Use this dashboard to understand your resource organization at a glance and identify dependencies between components.
Subscriptions
Navigate to: Cloud > Azure > required Azure monitor > Subscriptions. Monitor the status and utilization of all your Azure subscriptions in one place. This dashboard displays subscriptions, health status, and resource allocation. Identify which subscriptions are in use, and monitor subscription-level costs and quotas to ensure optimal resource distribution across your organization.
Service quotas
Navigate to: Cloud > Azure > required Azure monitor > Service Quotas. Track Azure service quota consumption and limits across your subscriptions. This dashboard shows current usage against quota limits for services like compute, storage, networking, and databases. Proactively manage resource requests before hitting quota thresholds and identify which services require quota increases to support business growth.
Management actions
Navigate to: Cloud > Azure > Management Actions. Monitor operations performed on your Azure resources over time. This dashboard logs all Create, Update, Delete, and other management activities across your subscriptions. Track who made changes, when they occurred, and which resources were affected to maintain an audit trail and ensure accountability for infrastructure changes.
All resources
Navigate to: Cloud > Azure > All Resources. Get a unified inventory of all Azure resources across your entire environment. This dashboard displays every resource in your subscriptions with filtering and search capabilities. Use it to discover resources, verify naming conventions, check resource types and locations, and identify orphaned or unused resources that can be cleaned up.
Guidance report
Navigate to: Cloud > Azure > Guidance Report. Receive actionable recommendations for optimizing your Azure infrastructure. This dashboard analyzes your resource configuration, performance, and cost patterns, then provides guidance on improving availability, reliability, security, and cost efficiency. Review recommendations by category and priority to implement best practices across your environment.
Resource dependencies
Navigate to: Cloud > Azure > Resource Dependencies. Understand the dependency relationships between your Azure resources. This dashboard maps how resources rely on and interact with each other—such as networks hosting VMs or databases connected to applications. Use this view to plan changes safely, assess the impact of resource modifications, and troubleshoot issues by tracing resource connections.