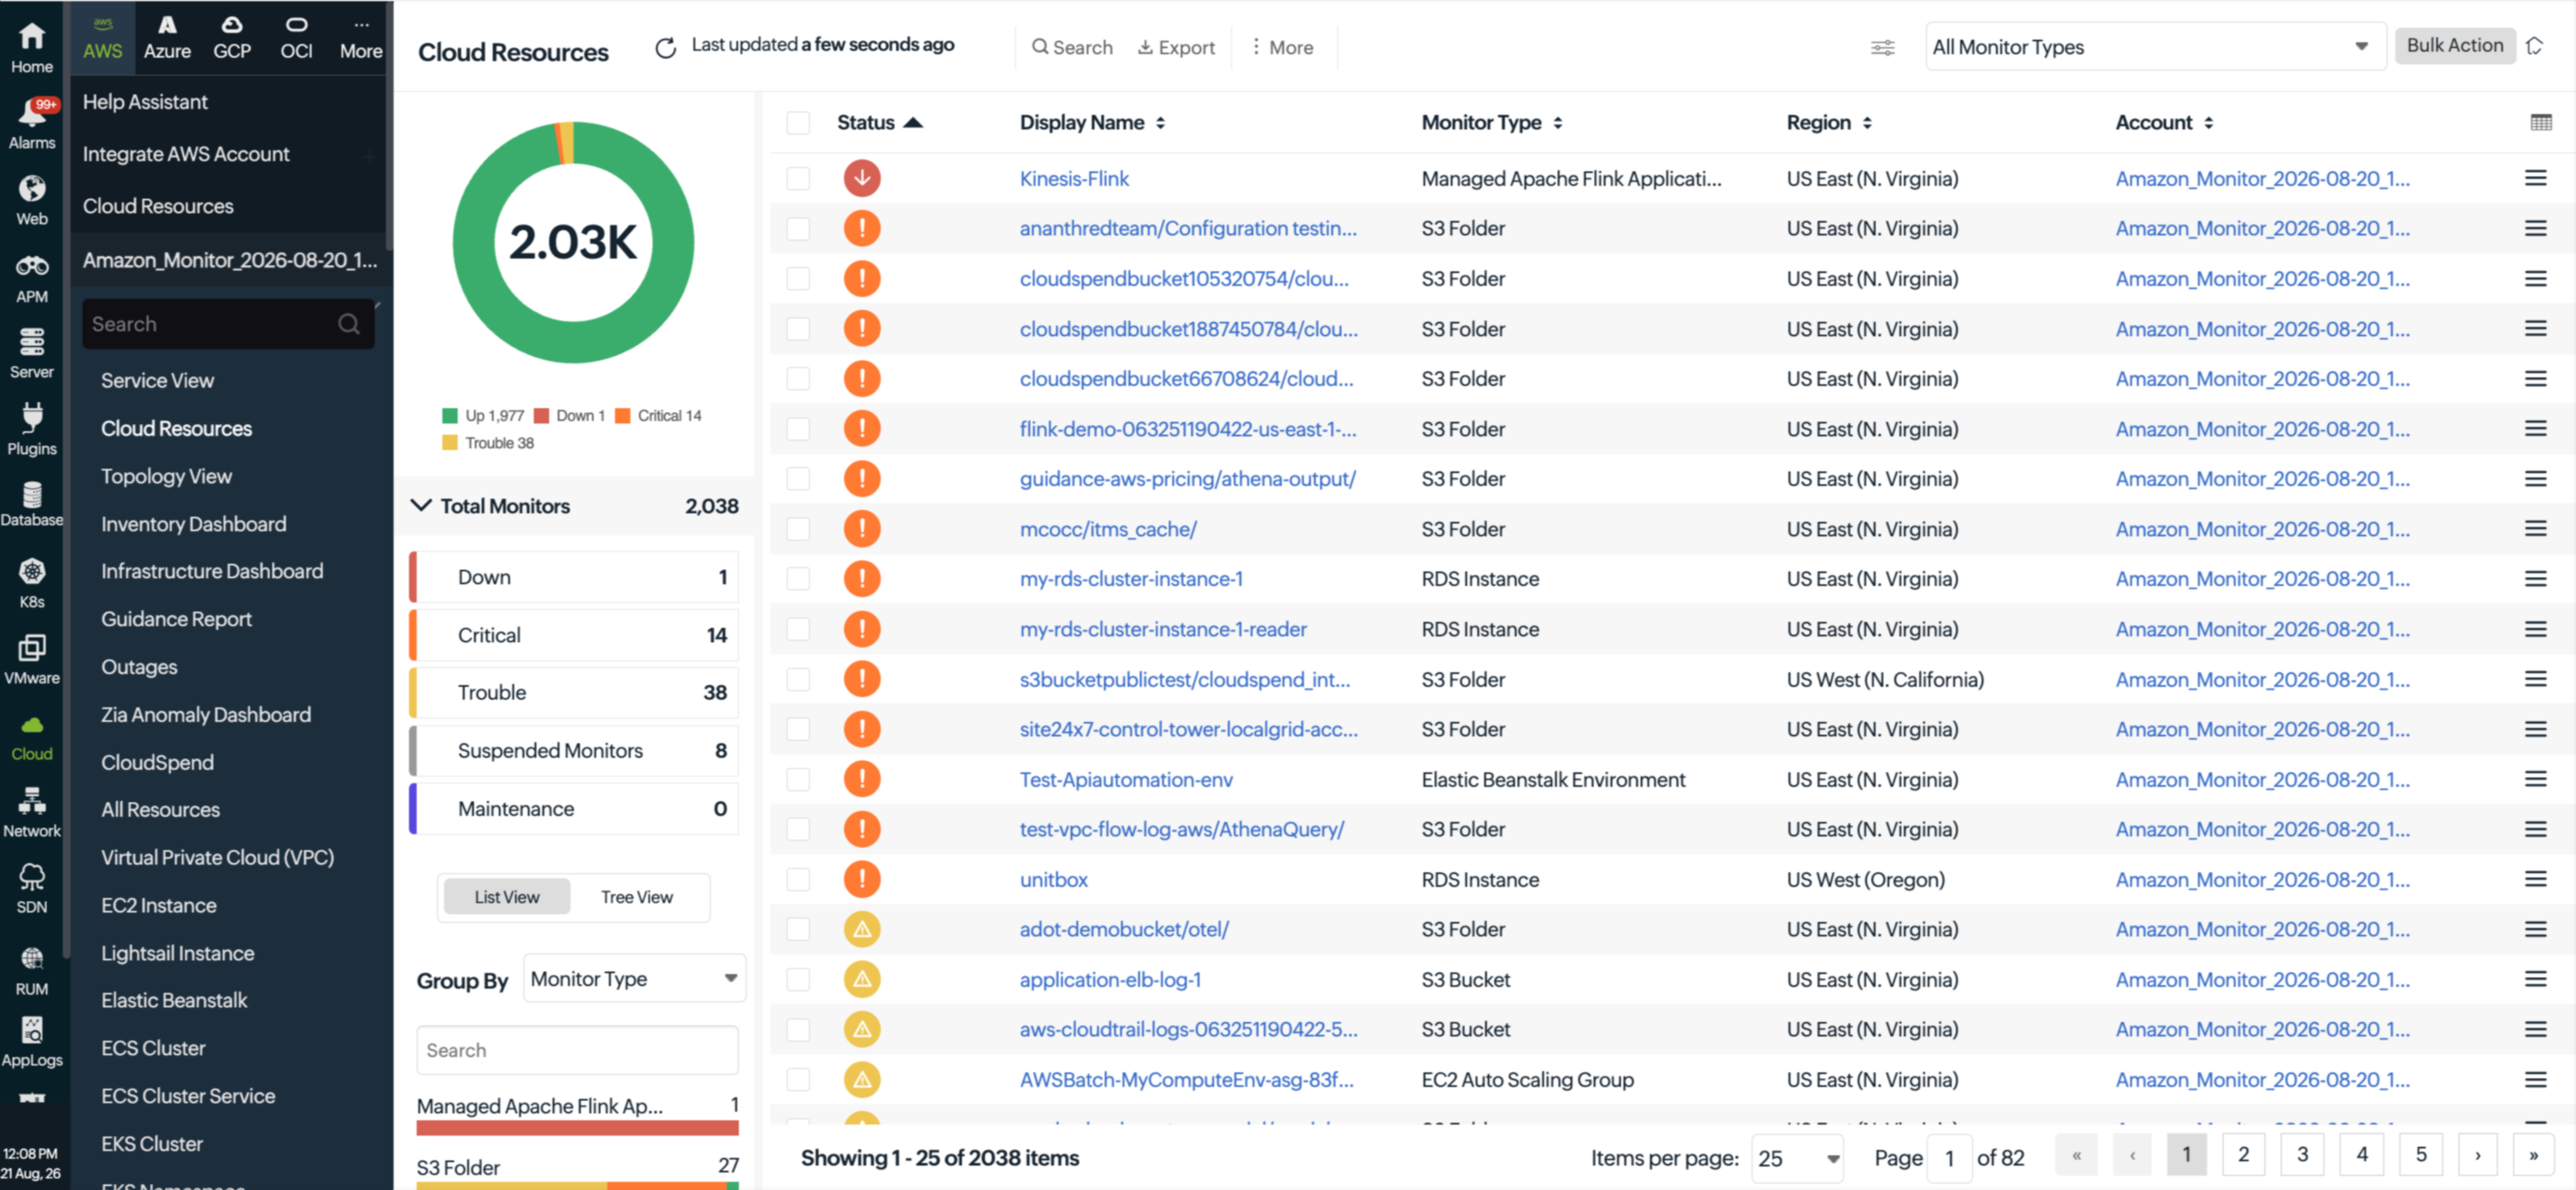
Cloud Resources dashboard for AWS
The Cloud Resources dashboard provides a consolidated view of all monitored AWS resources across your configured AWS accounts and regions. You can use the dashboard to check resource health at a glance, search and filter resources, group monitors by monitor type, view resource details, and perform actions on one or more monitors from a single page.
The dashboard is designed to provide a centralized operational view of your AWS monitoring environment, making it easier to identify resources that require attention and quickly access their detailed monitoring information.
Benefits of the Cloud Resources dashboard
The Cloud Resources dashboard helps you:
- Get a centralized view of all monitored AWS resources.
- Check the health of monitored resources from a single dashboard.
- Quickly identify resources that are Down, Critical, or in Trouble.
- Find resources by monitor type, account, or region.
- Organize resources into groups for easier navigation.
- Search for specific resources without navigating through individual AWS service pages.
- Perform supported actions on multiple monitors simultaneously.
- Move directly from the resource list to detailed monitor information.
Use cases
Quickly identify resources affected by an incident
An application is experiencing performance issues, and the operations team suspects that one or more AWS resources may be affected. In a large AWS environment, manually checking individual service dashboards can delay the investigation.
The admin opens the Cloud Resources dashboard to get an immediate view of the health of monitored AWS resources. The status summary shows the number of resources in each state. They select Down, Critical, or Trouble to filter the resource list and focus on the affected resources.
Locate a resource across accounts and regions
A team manages resources across multiple AWS accounts and regions and needs to locate a specific resource during troubleshooting. Finding the resource manually can be difficult when thousands of resources are being monitored.
The team uses the Search option to locate the required resource. The Account and Region columns also help them identify where the resource is deployed. The team uses the available grouping and filtering options to narrow down the resource list and quickly locate the required monitor.
Investigate issues with a specific AWS service
The team responsible for Amazon S3 notices that several monitored resources are reporting issues. They need to determine which S3 resources are affected without reviewing resources belonging to other AWS services.
The team can use the All Monitor Types filter to select the required monitor type. The team can also use Group By > Monitor Type to organize the resource list by service. This allows the team to focus on the relevant AWS resources and identify the monitors that require investigation.
Manage multiple monitors at once
An admin needs to perform the same action on multiple AWS monitors. Opening each monitor individually would require repetitive work.
They select the required monitors using the check boxes in the resource table and use Bulk Action to perform supported operations on multiple monitors simultaneously.
Move from resource health to detailed troubleshooting
The Cloud Resources dashboard identifies a resource that is experiencing an issue, but the operations team needs detailed performance and health information to investigate the cause. They click the Display Name of the affected resource to open its monitor details page. This provides a direct path from the centralized resource view to detailed monitoring information.
Understand the distribution of monitored resources
A team monitors a large AWS environment containing resources from multiple services, accounts, and regions. The team needs a quick way to understand how its monitored resources are distributed.
The team uses Group By to organize resources by the available grouping criteria. The resource count and status distribution shown for each group provide a quick overview of the monitored AWS environment and help the team identify areas that may require attention.
Manage resources in AWS Control Tower environments
Organizations using AWS Control Tower or Delegated Administrator may have resources distributed across multiple managed accounts. Identifying resources based on their AWS management structure can become difficult when working with a large number of monitors.
Administrators can use the available Control Tower and Delegated Admin columns to view the relevant AWS management information for monitored resources.
Prerequisites
To access the Cloud Resources dashboard, you must have:
- An active monitoring subscription.
- At least one AWS monitor configured in the monitoring application.
The required AWS permissions must be configured to allow the monitoring application to access and monitor the AWS resources. For information about setting up AWS monitoring, see the AWS monitoring integration documentation.
Navigate to the Cloud Resources dashboard for AWS
- Log in to the monitoring application.
- Navigate to Cloud > AWS.
- Select Cloud Resources.
The dashboard displays the monitored AWS resources associated with your configured AWS monitoring environment.
Monitor summary panel
The left panel provides a high-level summary of the monitored AWS environment.
Status summary
The donut chart displays the total number of monitored resources and their current status.
The status categories include:
- Up: The resource is operating normally.
- Down: The resource is unavailable or has failed the configured availability checks.
- Critical: The resource has violated a configured critical threshold and requires immediate attention.
- Trouble: The resource has violated a configured trouble threshold or requires attention.
Select a status segment in the donut chart to filter the resource table and view only monitors in that state.
Total Monitors
Total Monitors displays the total number of monitored AWS resources. The panel also provides the count of monitors in different states, including:
- Down
- Critical
- Trouble
- Suspended Monitors
- Maintenance
These counts provide a quick overview of the current state of the monitored AWS environment.
List View and Tree View
Use List View and Tree View to change how monitored AWS resources are displayed.
- List View displays the resources in a tabular format. Use this view to search, sort, filter, customize columns, and perform actions on monitors.
- Tree View provides a hierarchical representation of the monitored AWS resources, allowing you to navigate the resource structure more easily.
Filter and search resources
Use the controls available on the dashboard to find and focus on specific AWS resources.
Search
Use Search to locate a specific monitored resource. Enter relevant resource information to narrow down the resources displayed in the table.
All Monitor Types
Use the All Monitor Types drop-down menu to filter the resource list by monitor type. For example, you can select a specific AWS resource type to view only the corresponding monitors. Select All Monitor Types to clear the filter and display all monitored resources.
Export
Use Export to export the resource information displayed in the dashboard. The exported information can be used for further analysis, documentation, or record keeping.
Group By
Use the Group By drop-down menu to organize monitored AWS resources based on the available grouping options.
The default grouping option is Monitor Type. Other grouping options include Region and Account. Select a group to filter the resource table and view the monitors belonging to that group.
Grouping helps you organize large numbers of monitored resources and focus on resources based on their monitor type, region, account, or applicable AWS management structure.
Inventory table
The inventory table provides detailed information about the monitored AWS resources.
The following columns are available:
| Column | Description |
|---|---|
| Status | Displays the current health status of the resource using a color-coded status icon. |
| Display Name | Displays the name of the monitored AWS resource. Click the name to open the corresponding monitor details page. |
| Monitor Type | Displays the AWS resource type being monitored. |
| Region | Displays the AWS region where the resource is deployed. |
| Account | Displays the AWS account associated with the monitored resource. |
| Control Tower | Displays the associated AWS Control Tower information. This is an optional column that can be enabled through column customization. For standalone AWS accounts, the value is displayed as N/A. |
| Delegated Admin | Displays the associated AWS Delegated Administrator information. This is an optional column that can be enabled through column customization. For standalone AWS accounts, the value is displayed as N/A. |
You can sort the resource list by clicking the column headers. Click the action icon at the end of a row to access the supported actions for that individual monitor.
Column customization
Use column customization to select the information you want to display in the inventory table. The Control Tower and Delegated Admin columns are optional and can be enabled when required. You can sort the resource list by clicking the column headers.
Click the Display Name to open the corresponding resource monitor. Click the account name to open the parent AWS account monitor.
Click the action icon at the end of a row to access the supported actions for that individual monitor.
Bulk Action
Use Bulk Action to perform supported operations on multiple AWS monitors simultaneously.
To perform a bulk action:
- Select the required monitors using the check boxes in the table.
- Click Bulk Action.
- Select the required operation.
- Complete the action as prompted.
Bulk actions help reduce repetitive administrative work when the same operation needs to be performed on multiple monitors.
Pagination
The dashboard displays a specific number of resources on each page. Use the Items per page drop-down menu to control the number of resources displayed on a page. Use the pagination controls to navigate between pages and access additional resources.
The pagination section also displays the total number of resources and the range of resources currently displayed.
View monitor details
Click the Display Name of a resource to open its corresponding monitor details page. The monitor details page provides detailed health, performance, metric, and alert information available for that resource.
Use the Cloud Resources dashboard for a centralized resource view and the individual monitor page for detailed resource-level investigation.