UI pages for integrated EC2 instance monitor
The following document will detail about the additional UI components you'll be getting with the integrated EC2 instance monitor. If you want to learn more about on:
- How you can deploy the agent on your Linux and Windows based EC2 instance
- How you can enable our "one click integrate" to connect your existing EC2 CloudWatch monitor and server monitor
- The benefits of our EC2 CloudWatch and agent integration
Once the integration is done, under the home tab, in the Monitor Status page, the integrated EC2 instance monitor will get listed. Here to differentiate the integrated EC2 instance monitor from the EC2 CloudWatch monitor we have brought in a visual cue – An agent icon will be displayed adjacent to the monitor name.
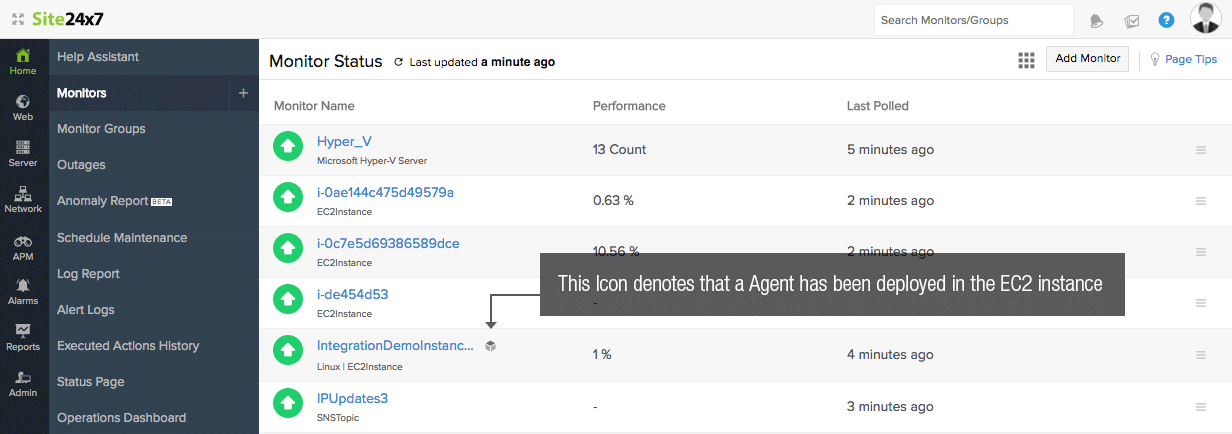
Also information about the type of agent deployed, which in the case of the above example – Linux will also be displayed below the display name of the monitor
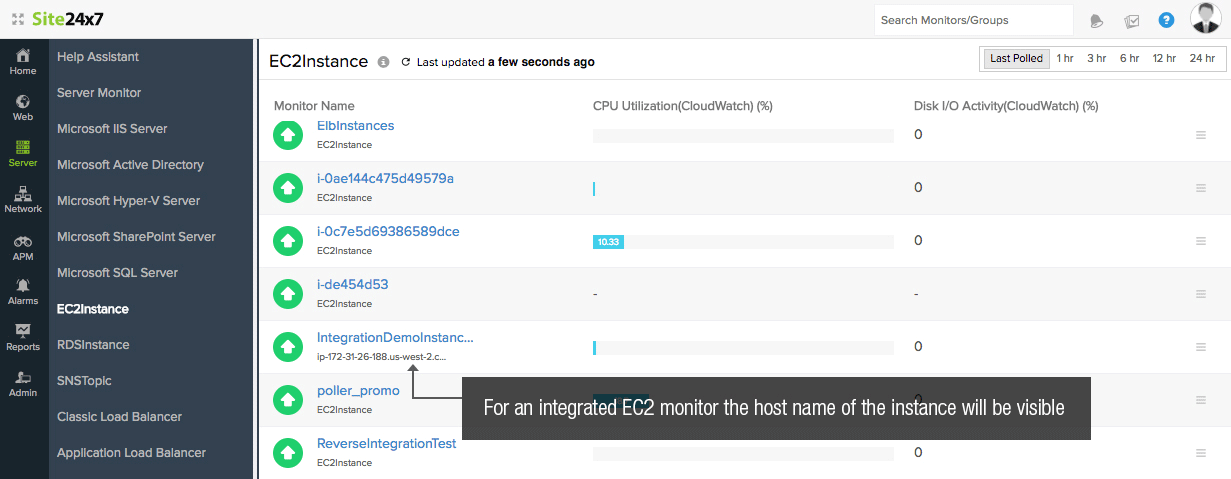
If you navigate to the EC2 instance summary page, you'll find that the host name of the EC2 instance will be shown below the display name for an integrated EC2 instance monitor
Additional components in your dashboard tab
In addition to EC2 summary, volumes and EC2 inventory tabs, the integrated view will contain additional tabs. You can also create your own tab with custom metrics if you want. Also the EC2 instance summary tab will show additional charting and graphs for various system performance metrics like Physical CPU usage, memory utilization, system load average, system idle/busy time, thread count etc.
A visual differentiation of the EC2 CloudWatch monitor and integrated EC2 instance monitor can be seen below. Here you can see the additional dashboard tabs available.


For Linux based EC2 instances you will be getting the following additional tabs
- CPU
- Memory
- Disk
- Processes
- Plugins
- Checks
- Network
- Sys logs
- Process viewer
For Windows based EC2 instances you will be getting the following additional tabs
- CPU
- Memory
- Disk
- Services and Processes
- Network
- Plugins
- Checks
- Server tools
A detailed description about the various dashboard tabs and additional charts and graphs can be seen below.
EC2 summary page
The summary page will contain performance charts and graphs for both EC2 CloudWatch metrics and the agent driven system metrics.
Volumes
The volumes tab displays time series graphs for various performance metrics like bandwidth, throughput, latency for attached EBS volumes.
EC2 inventory
The EC2 inventory tab will contain, both the instance configuration details and EC2 host details.
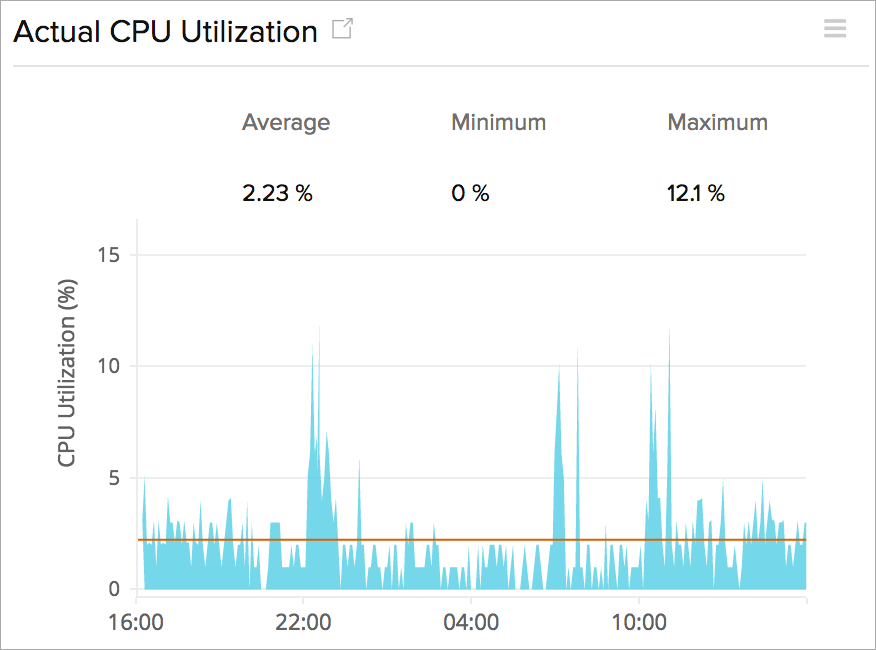
Physical CPU utilization
For any given time period, view the actual CPU utilization and CPU usage by cores for your physical host. Gather statistics on processor interrupts and context switches. Configure CPU thresholds to identify abnormal spikes.
Memory
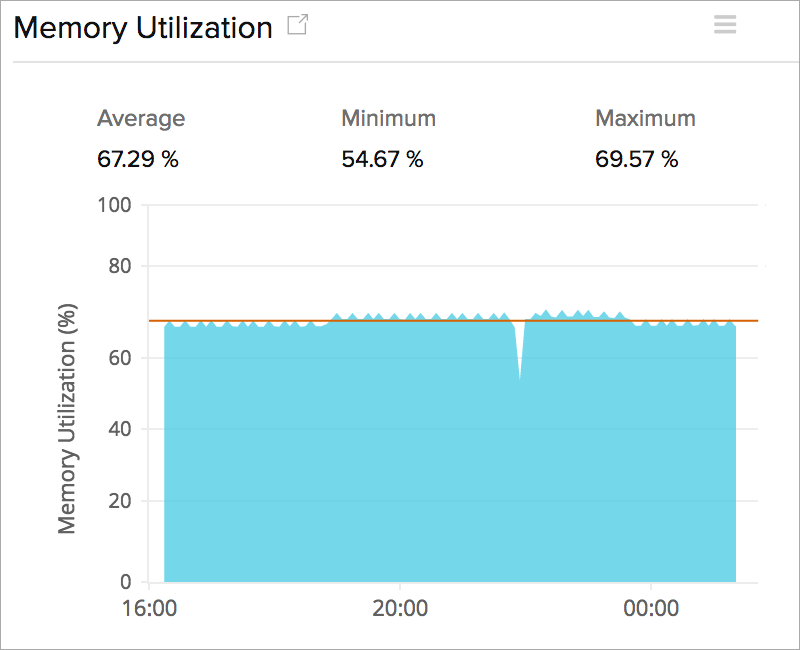
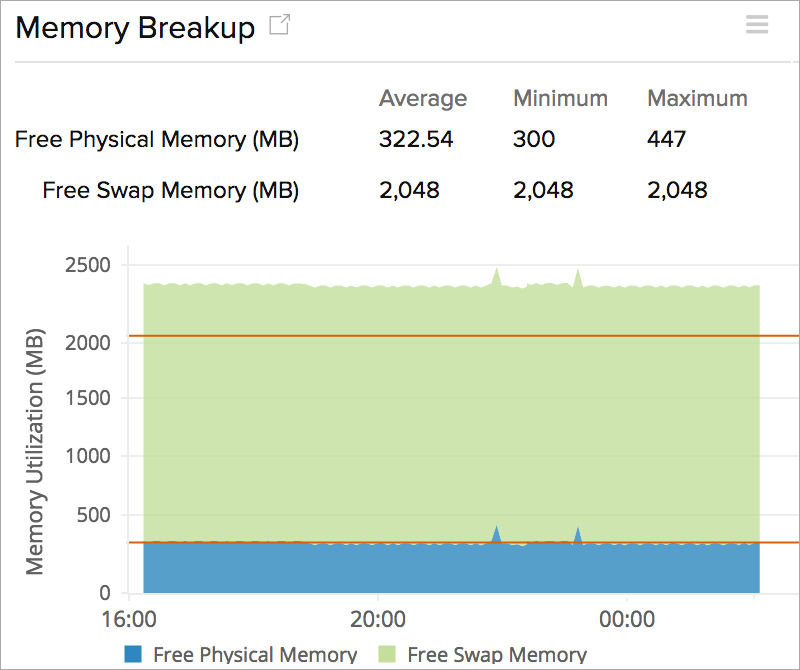
View average memory utilization for your instance. Get memory break up, compare free memory to used bytes, monitor swap usage, setup memory based alerts to discover page faults.
Disk
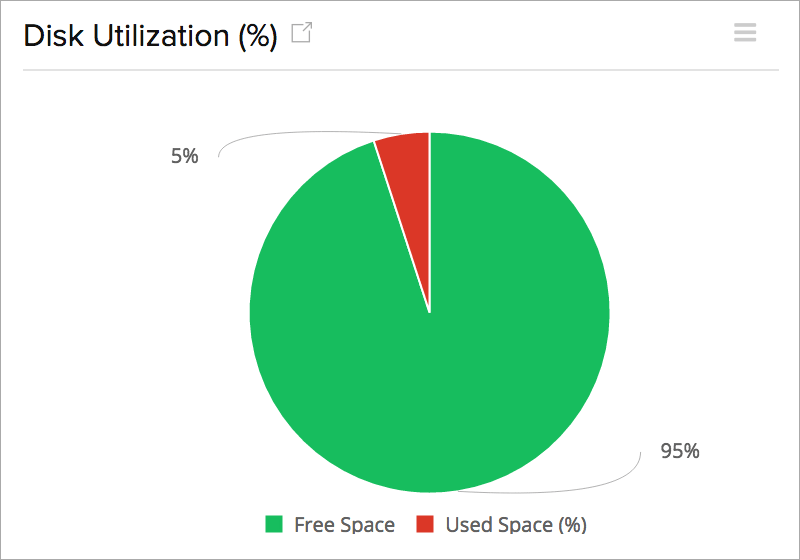
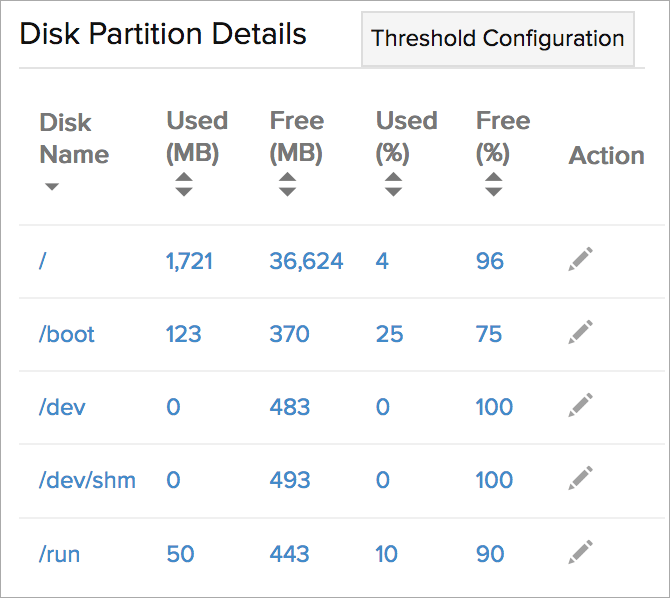
Monitor filesystem usage for attached EBS volumes. Check free space usage, Anlayze individual disk utilization and gain insight into disk I/O performance.
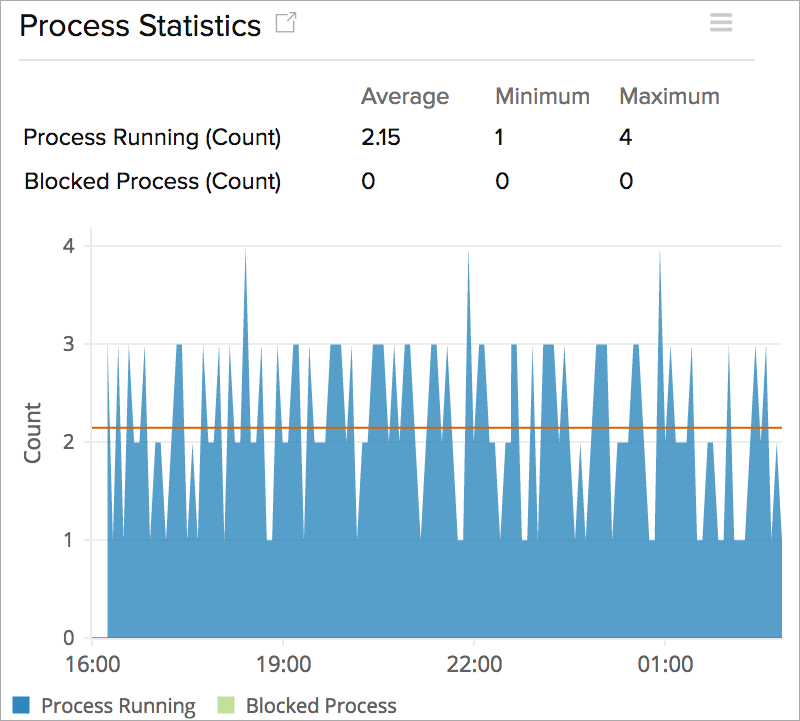
Processes
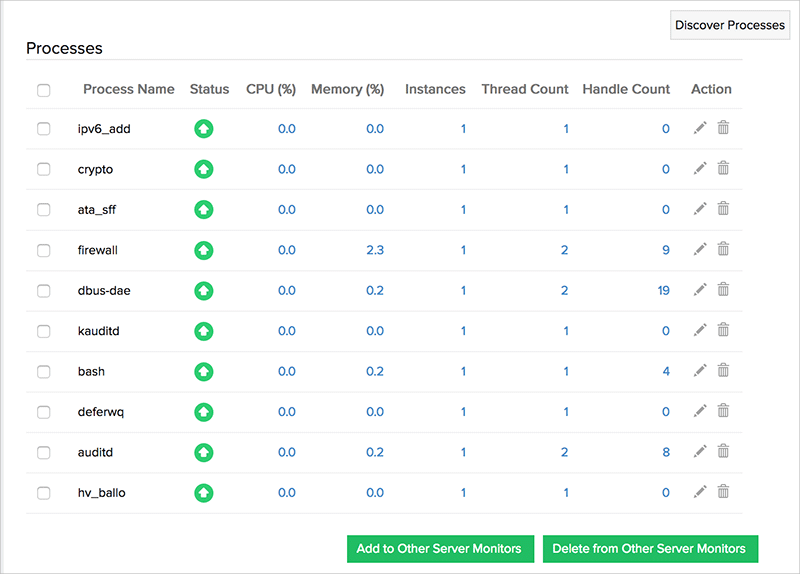
Discover and add active processes and Windows services. Identify the top process by CPU/Memory over a period of time. Set up thresholds to monitor CPU, memory, thread and handle count for each process
Network
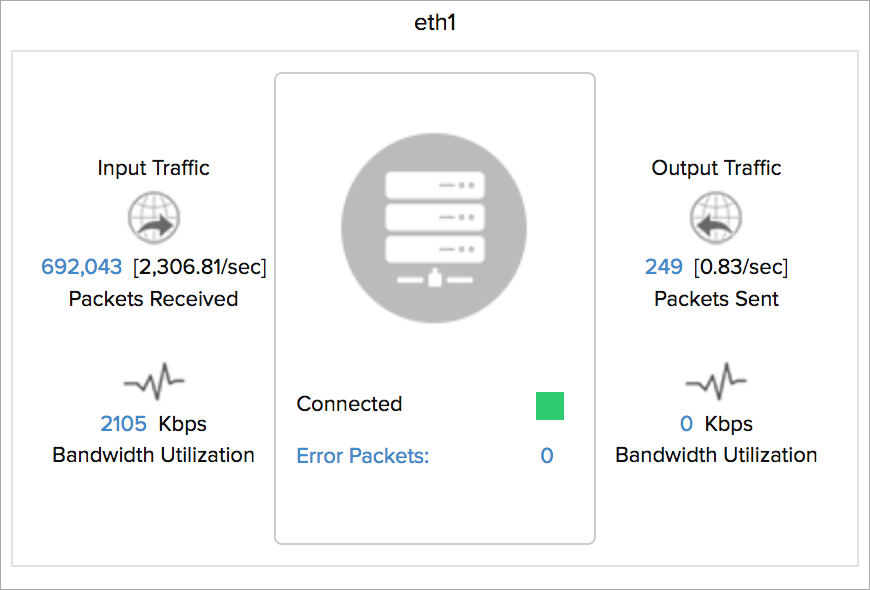
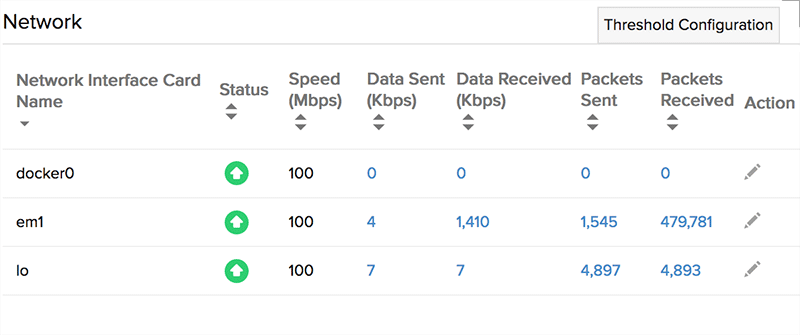
For each individual elastic network interface, view bandwidth utilization in terms of bytes and packets. Configure thresholds to identify errors and dropped packets.
Plugins
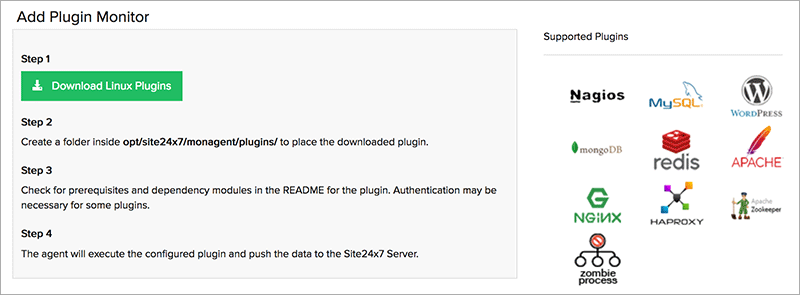
By installing and executing the plugins on your agent, you can monitor various resources on your AWS stack. We currently offer more than 50 out-of-the box Linux plugins. You can also write your own plugins in DLL, PowerShell, Batch or VB scripts for Windows instances. Read our product documentation to learn more about plugins
Windows event logs and Linux Sys logs
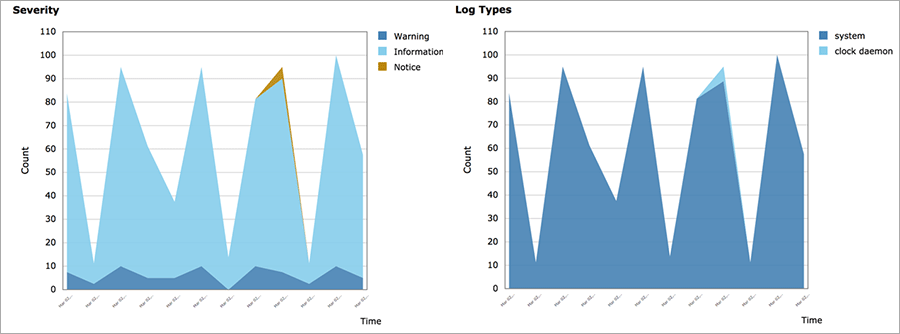
You can configure rules to identify critical events and anomalies in your Windows event log or Linux Sys log. You can also visualize and group your events by severity, log type and source.
Checks
Out of box utilities to check filesystems, directories, ports and URLs. Read our product documentation to learn more about the various resource checks that can configured.

Process viewer
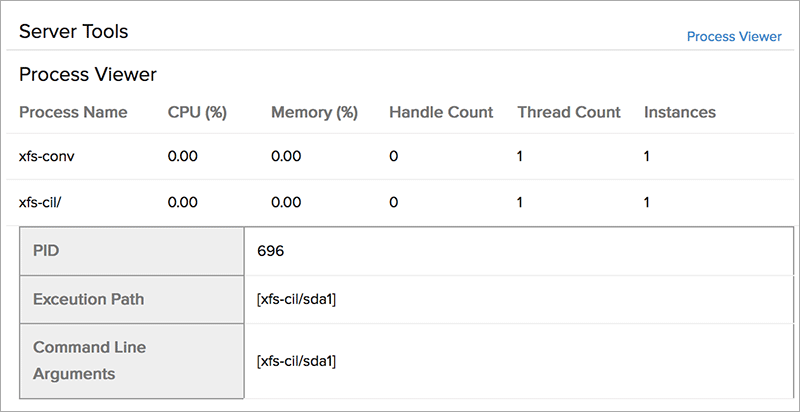
The View shows a list of currently active process, including process identification numbers, execution path and command line arguments
-
On this page
- Additional components in your dashboard tab
