RUM Reports
Get detailed insights into your website's performance with RUM reports.
To view reports:
- Log in to the Site24x7 web client.
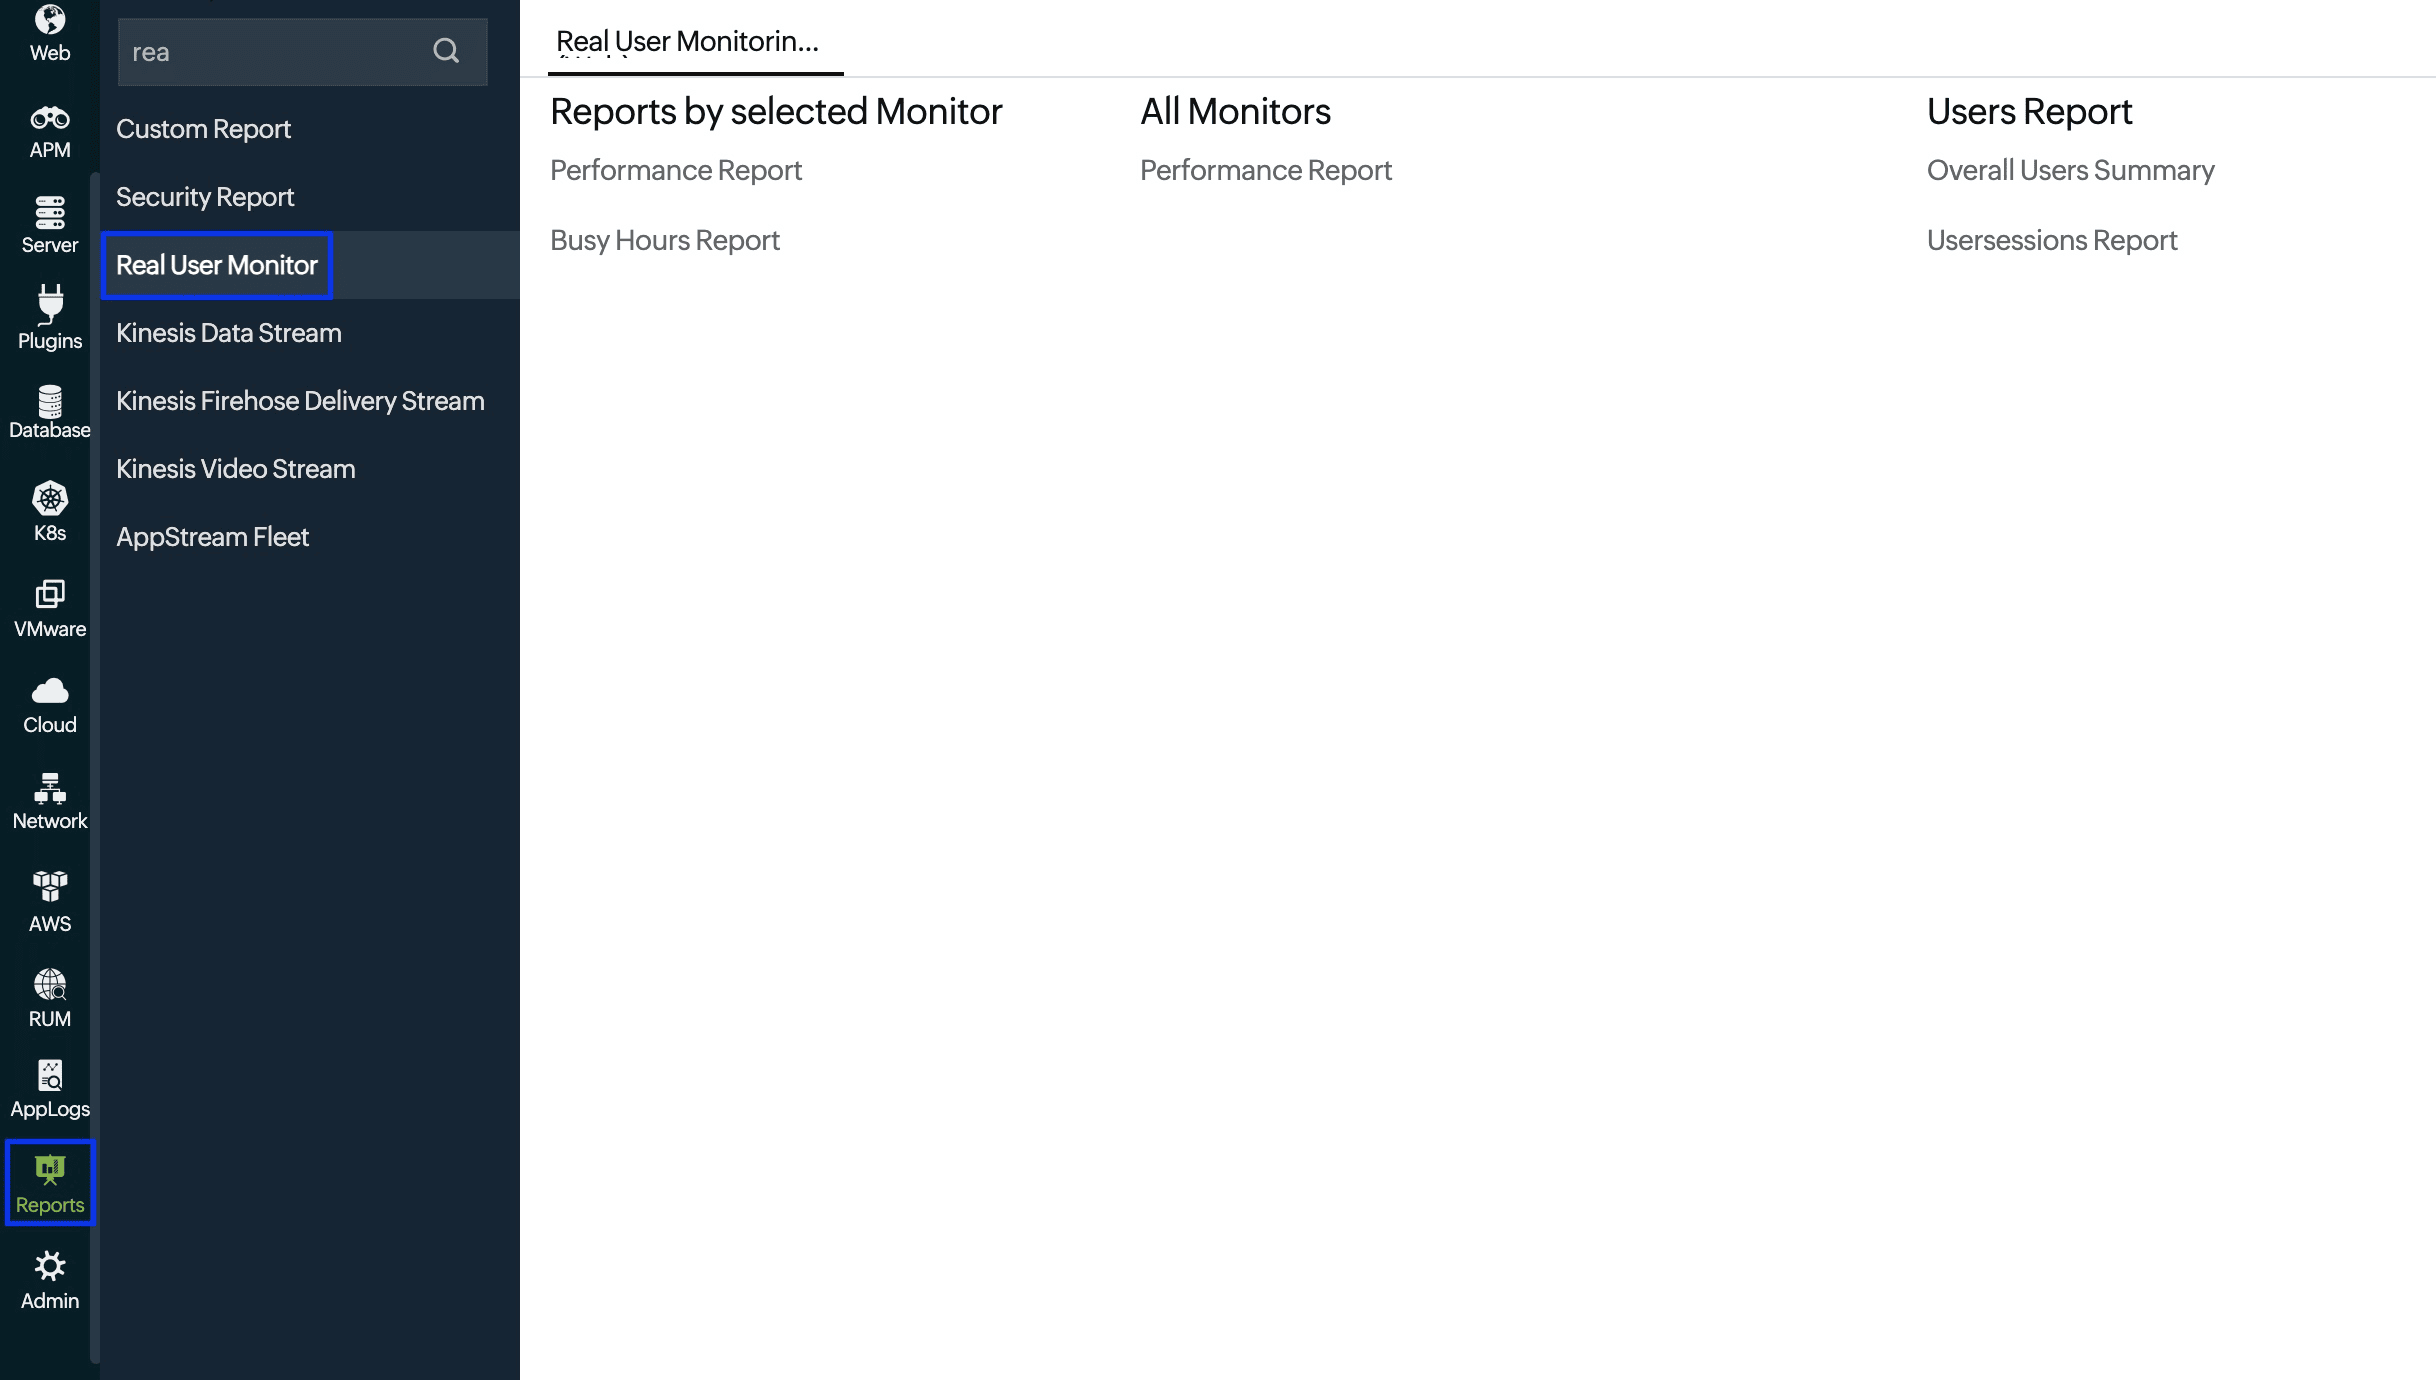
- Navigate to Reports > Real User Monitor.
- Click on the required report.
Performance Report
You can view performance reports for metrics like response time, Apdex score, throughput, users, and web vitals for the chosen monitor and for a specified time frame.
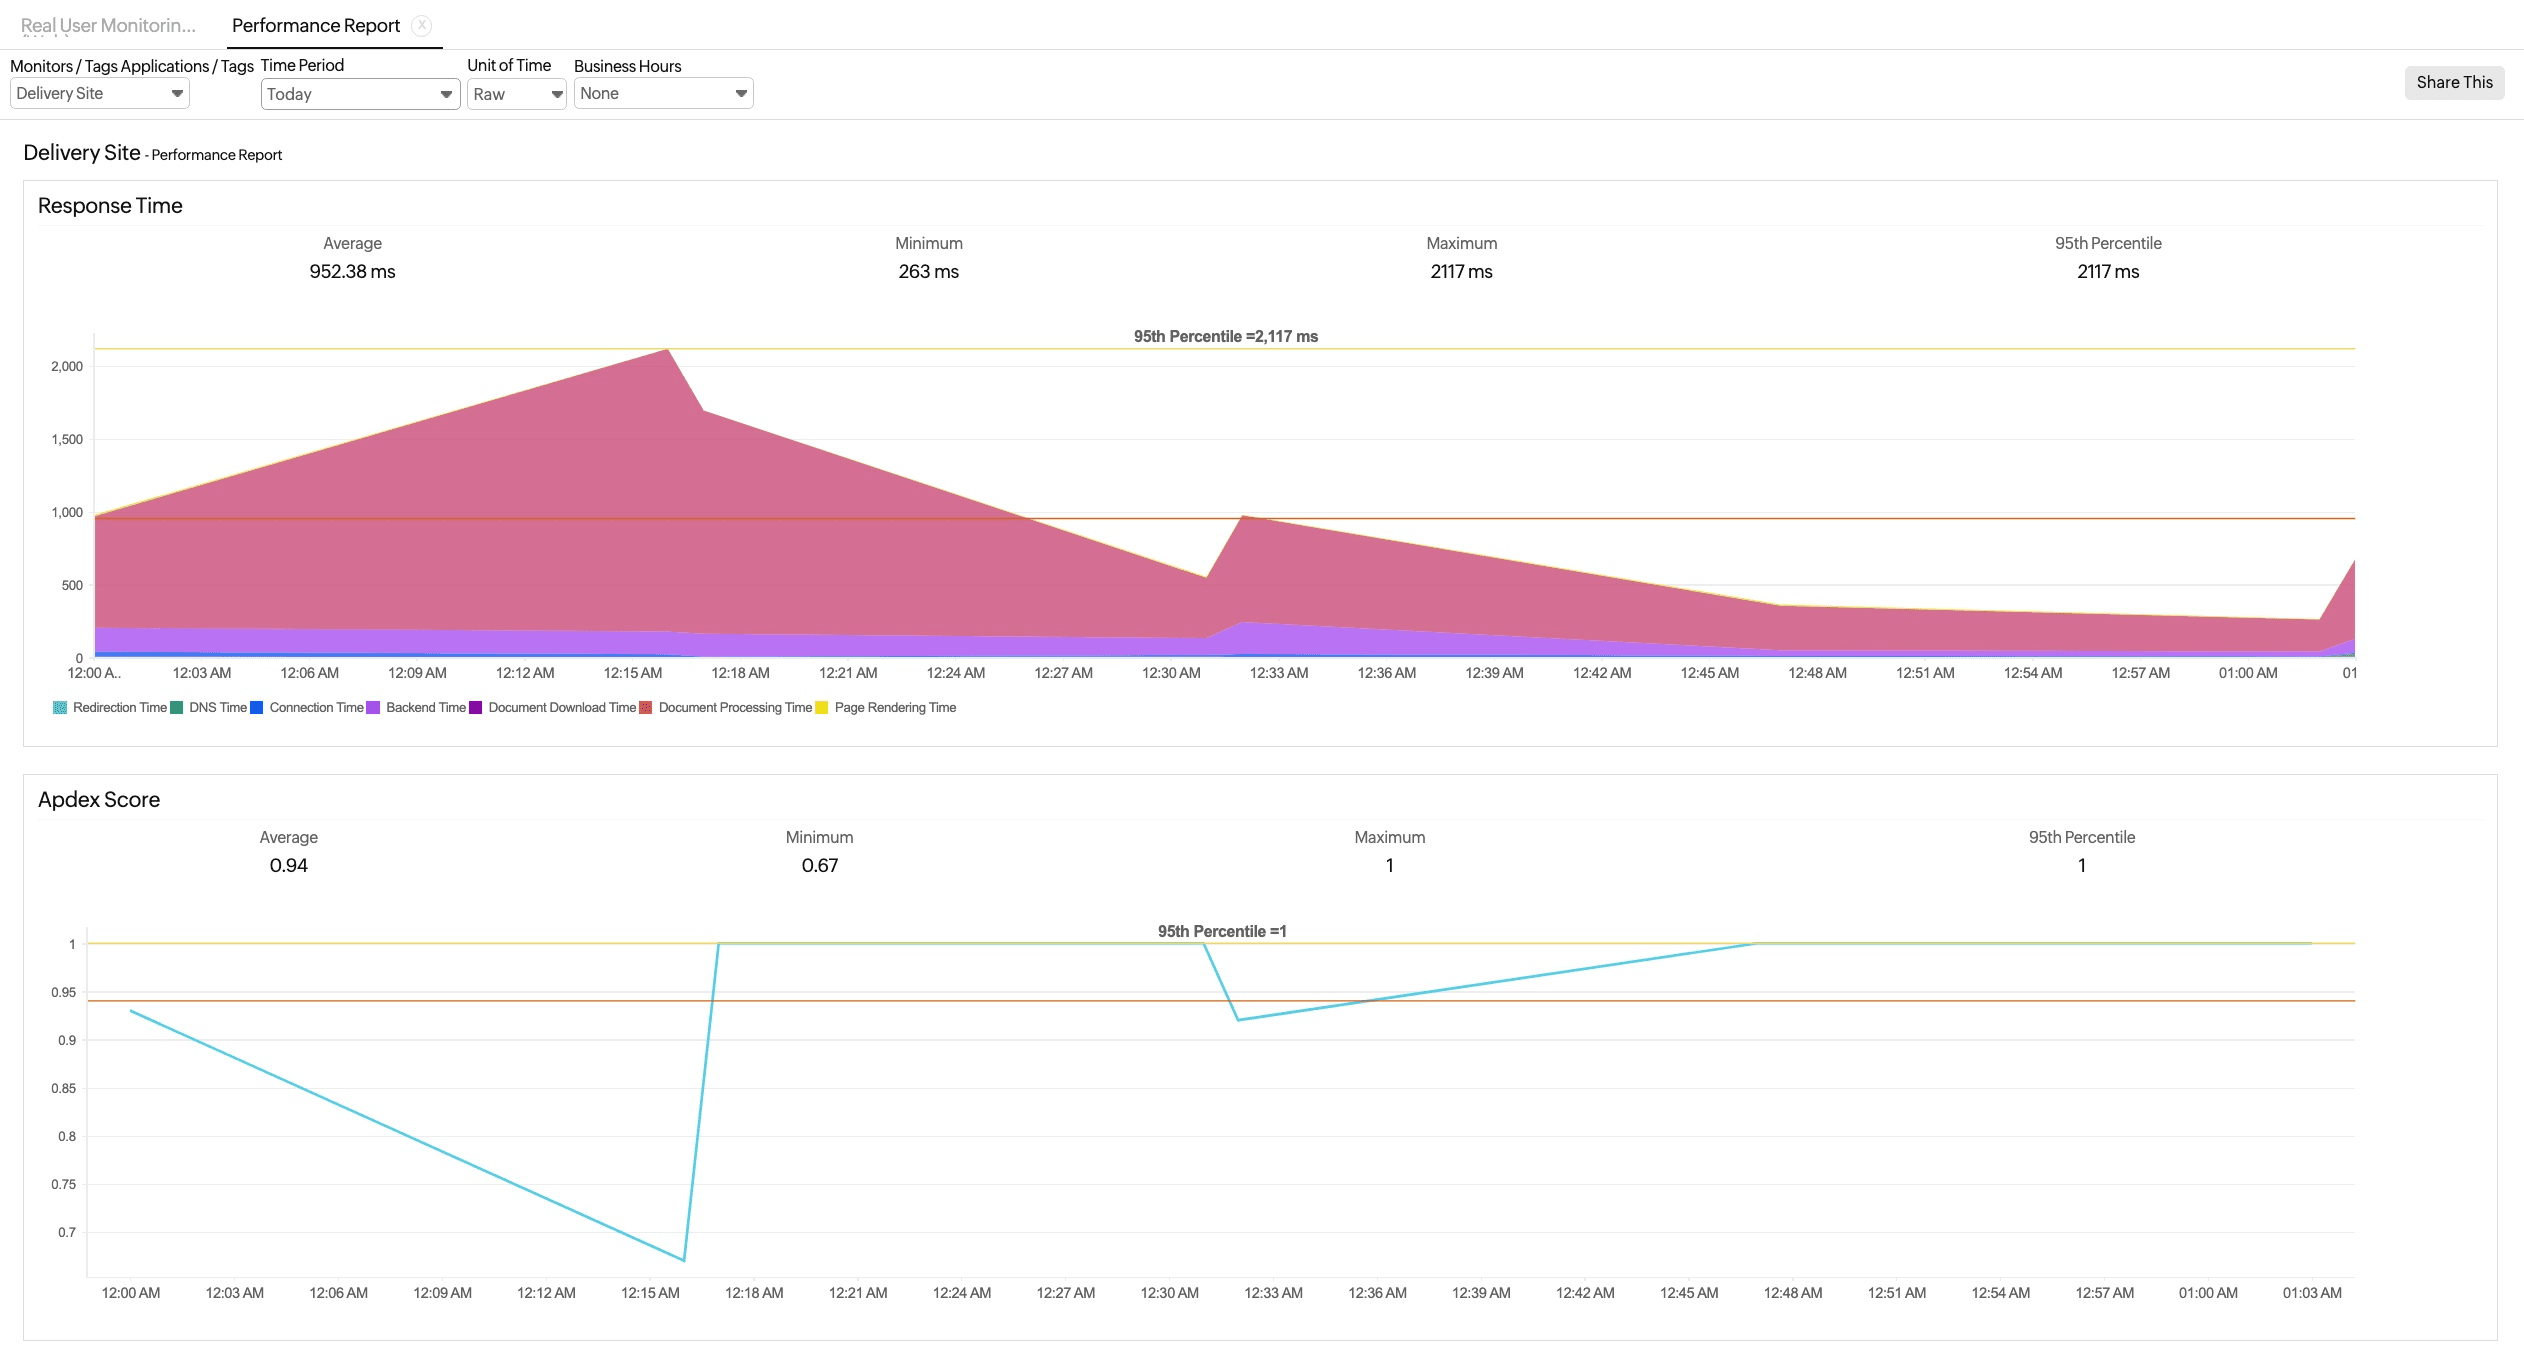
To view the performance of all monitors in a single report, click the Performance Report option under All Monitors.
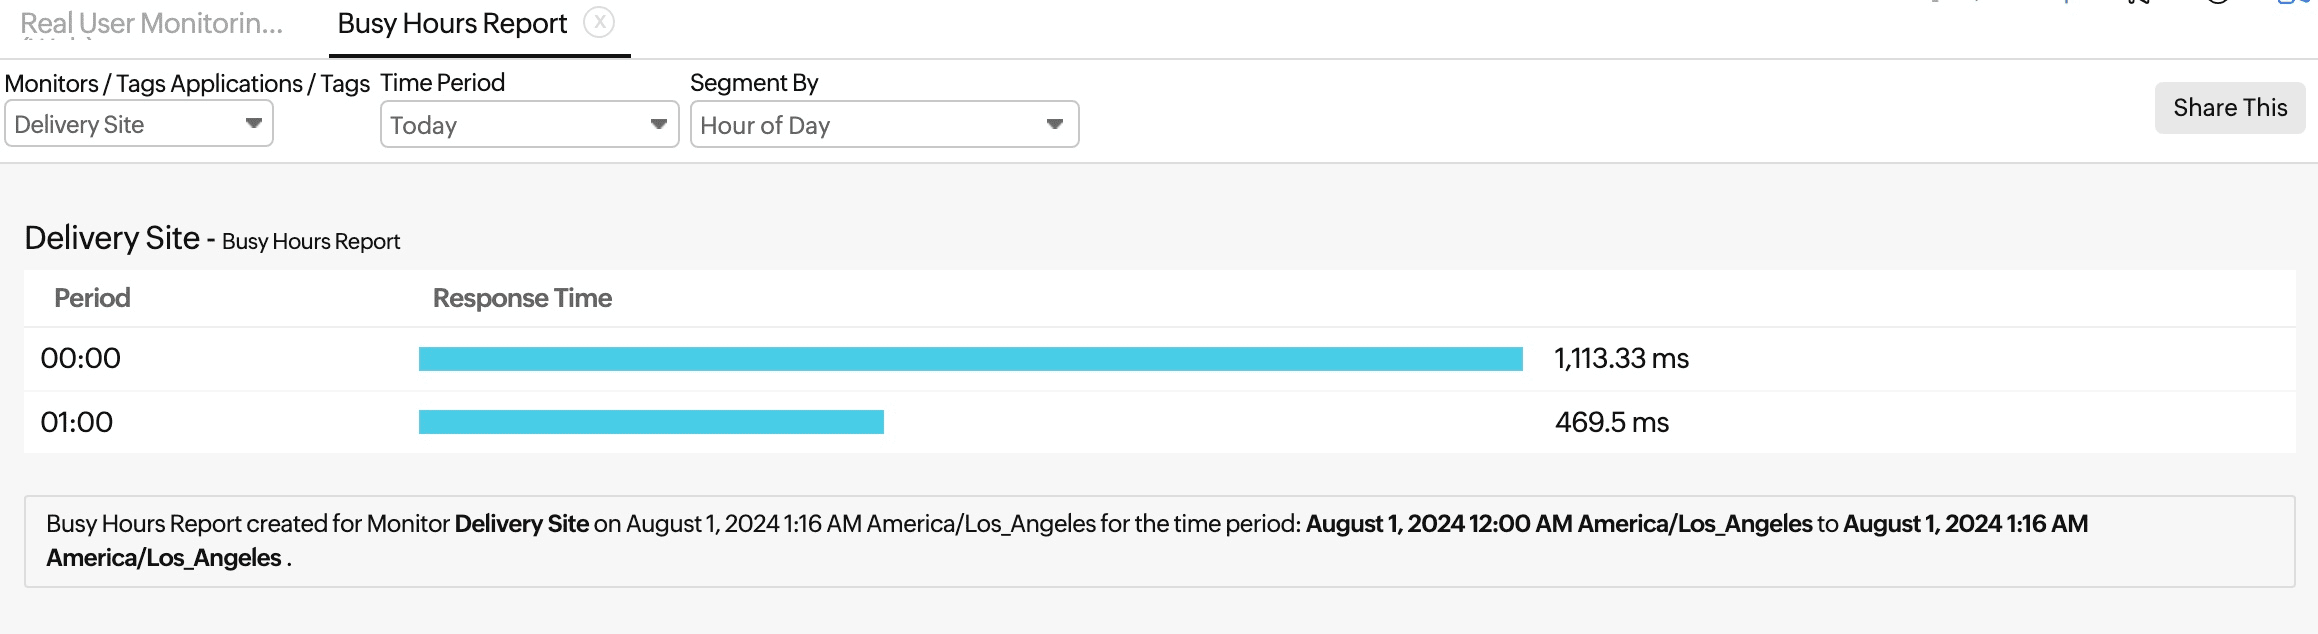
Busy Hours Report
You can view the Busy Hours Report for your application's response time on an hourly basis for a selected day, week, or month, or on a daily basis over a specific week or month. Learn more.
You can schedule maintenance for your RUM monitors. This will suppress alerts during maintenance. Learn more about scheduled maintenance.
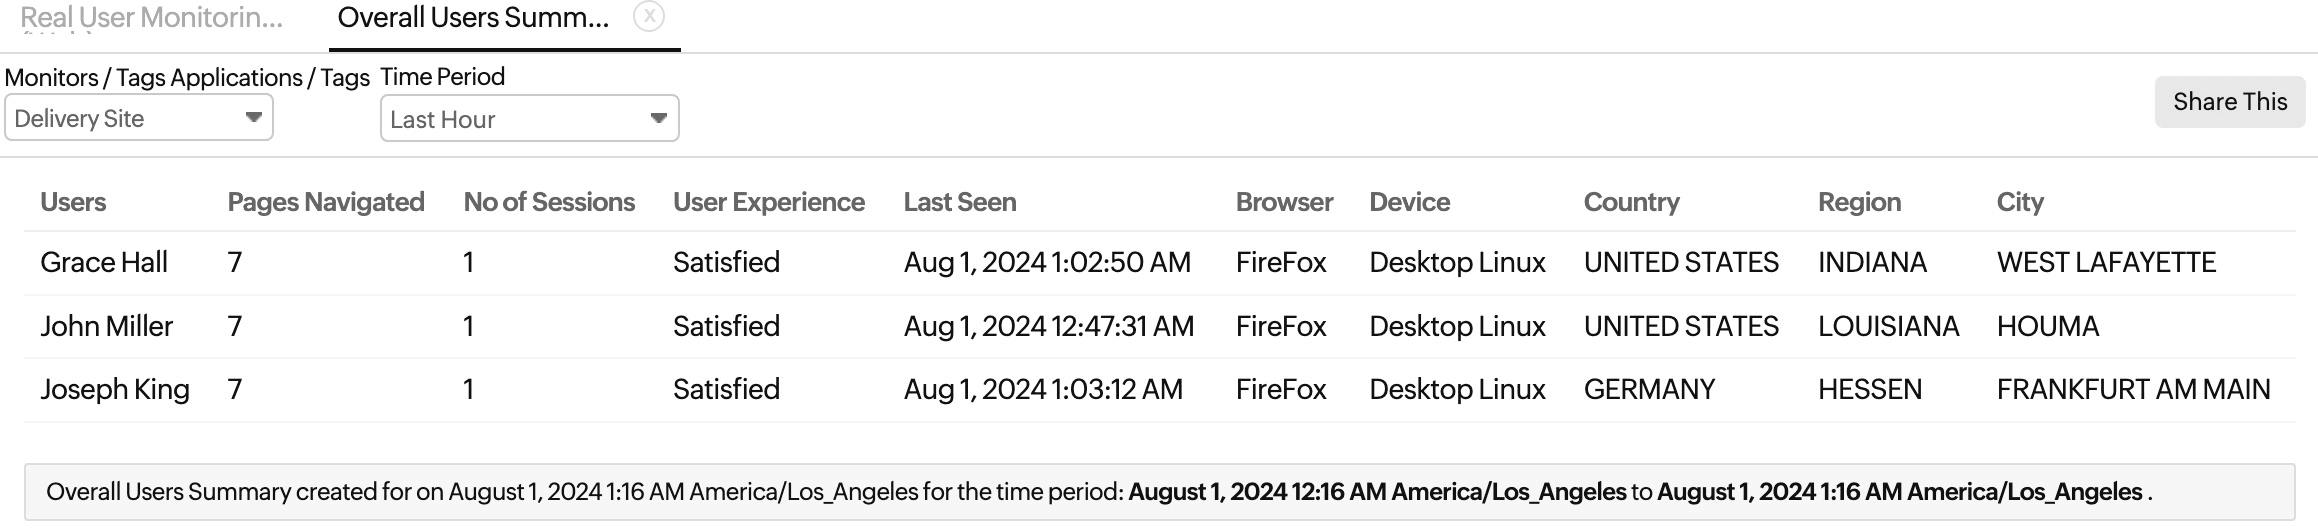
Overall Users Summary
This report provides a snapshot of the overall user summary, showing key details like pages navigated, number of sessions, user experience, last seen time, and geographic location for each user within a specified time period.
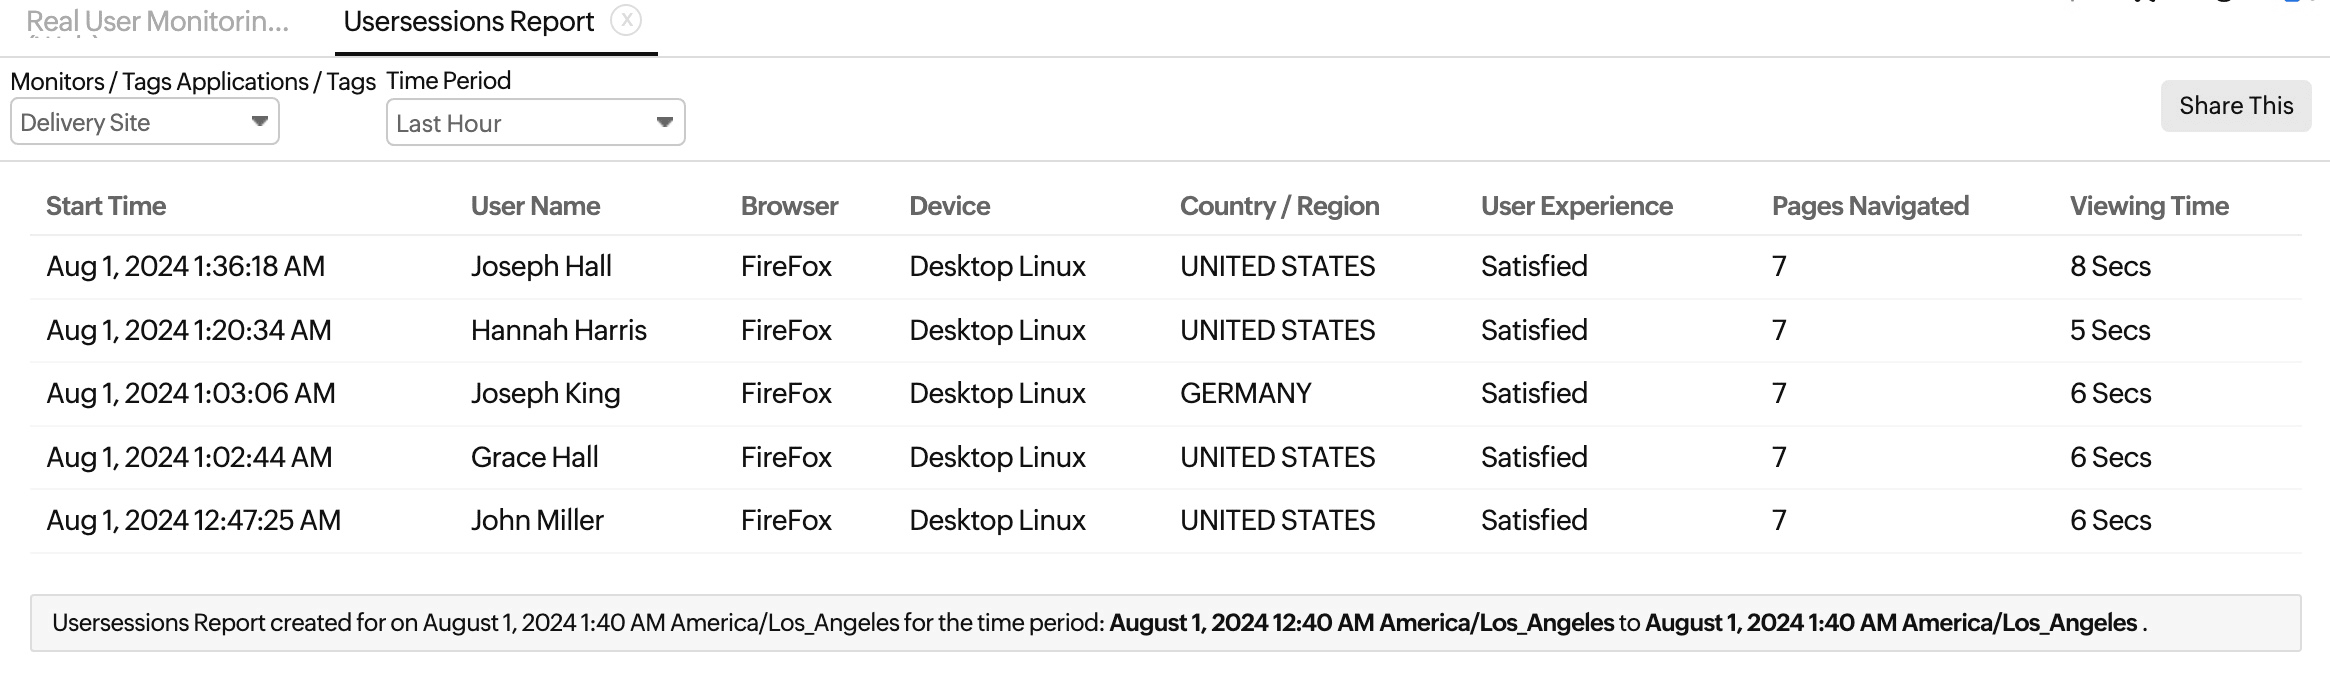
User Sessions Report
The report provides a detailed summary of user sessions, including user names, browsers, devices, pages visited, session counts, user experiences, geographic information, and viewing times over a specified period.