Filterable Performance
You can analyze your website performance by filtering it based on various parameters, including browsers, devices, countries, users, domains, and Internet service providers (ISPs). This helps you identify granular details that impact your website performance, and the end-user's experience.
Video
Here's a quick video on how filterable performance works.
To filter and analyze your website performance:
- Log in to your Site24x7 account > RUM > Your application > Filterable Performance
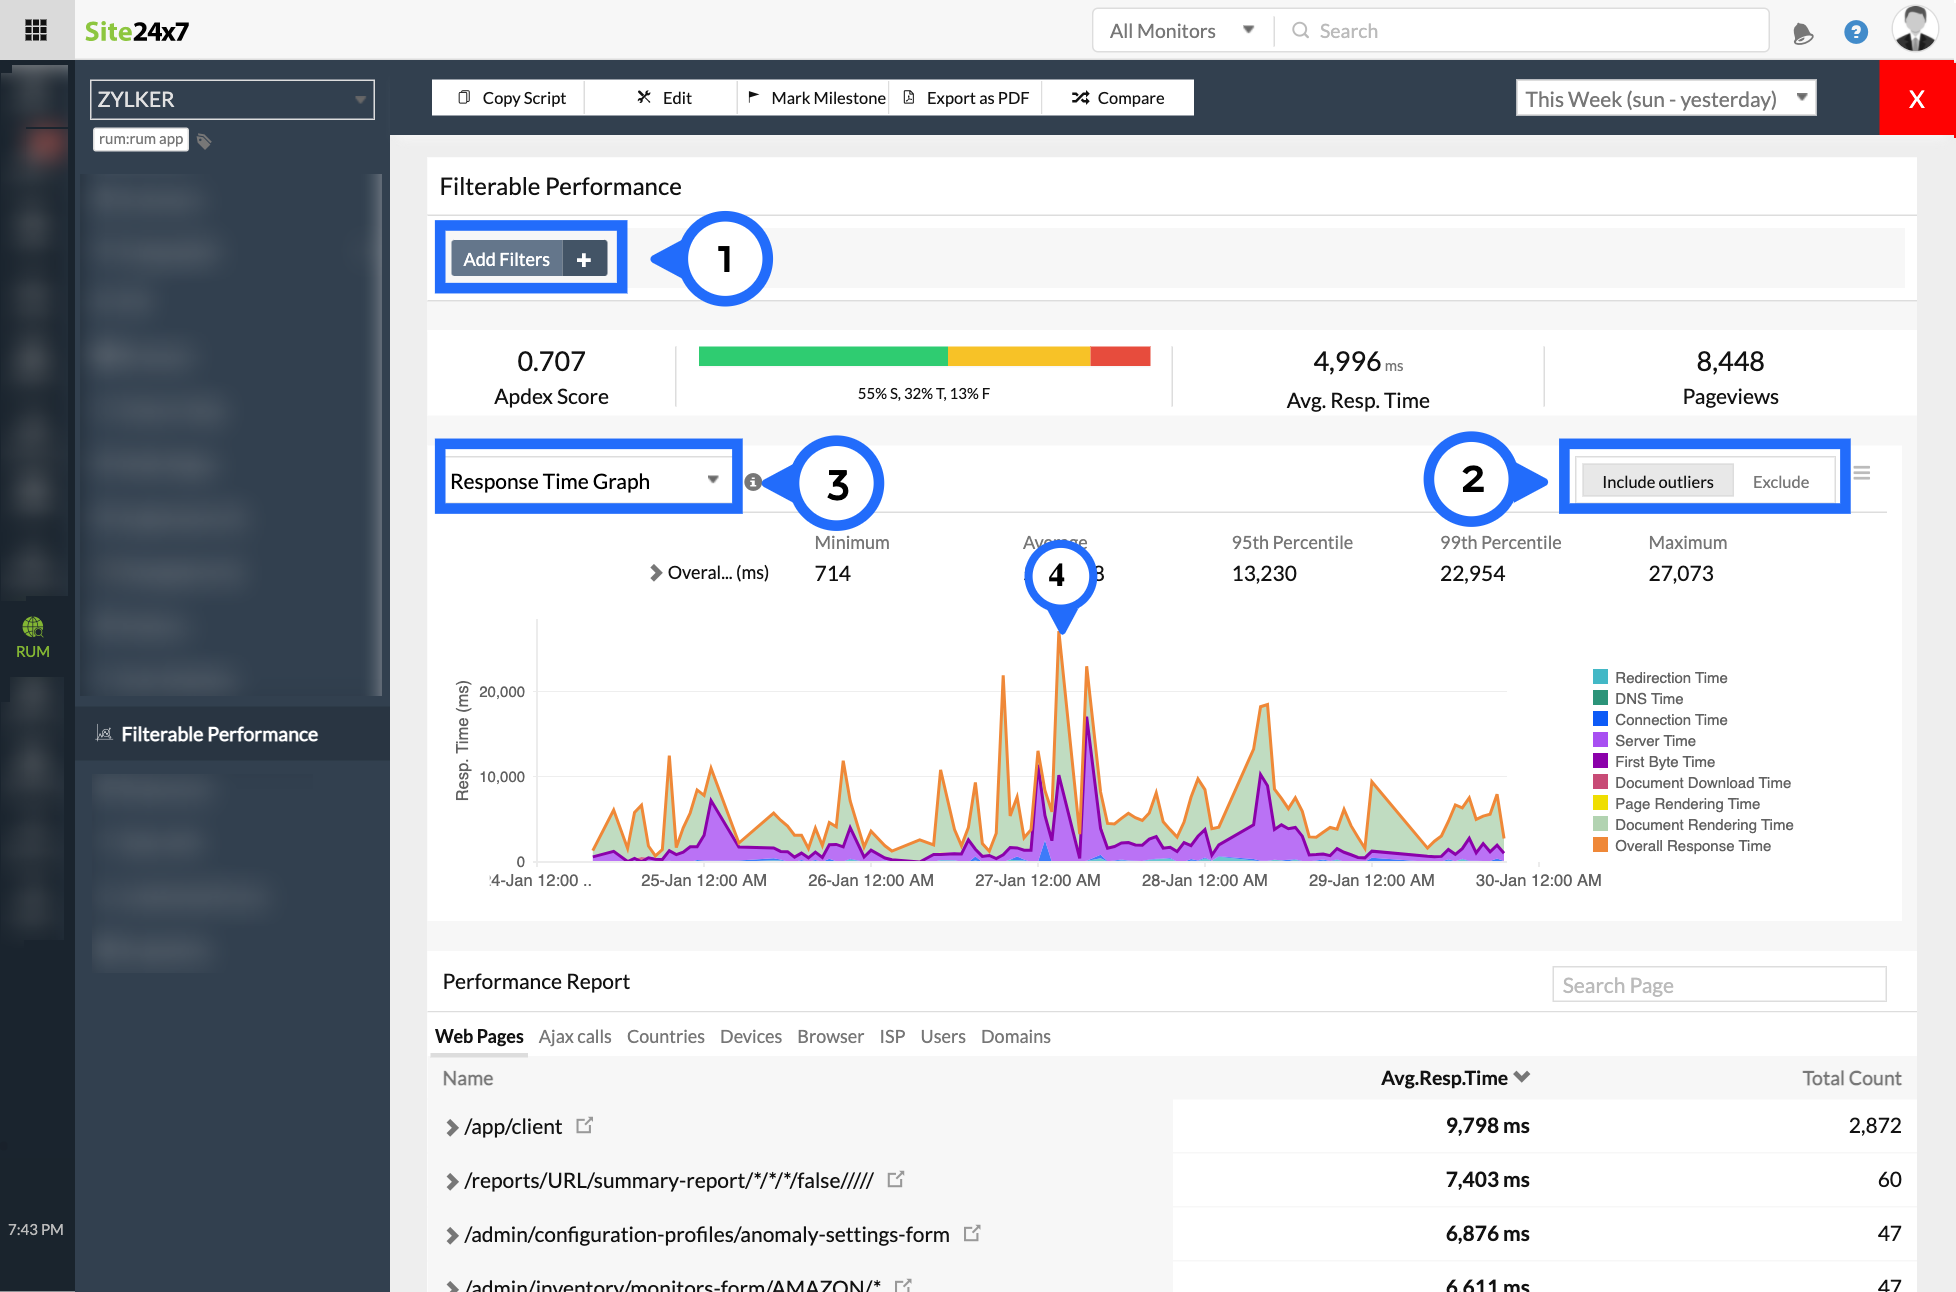
Figure 1: Overview of Filterable Performance
- Click on Add Filters to drill down into performance based on browser, users, devices, country, and ISP. You can also filter and view the performance of individual webpages or Ajax calls.
- You can include or exclude outliers while filtering performance data.
- You can view the overall website performance based on response time, or on user sessions.
- You can click on a particular point in the graph to inspect a specific timeframe further. The time window changes accordingly.
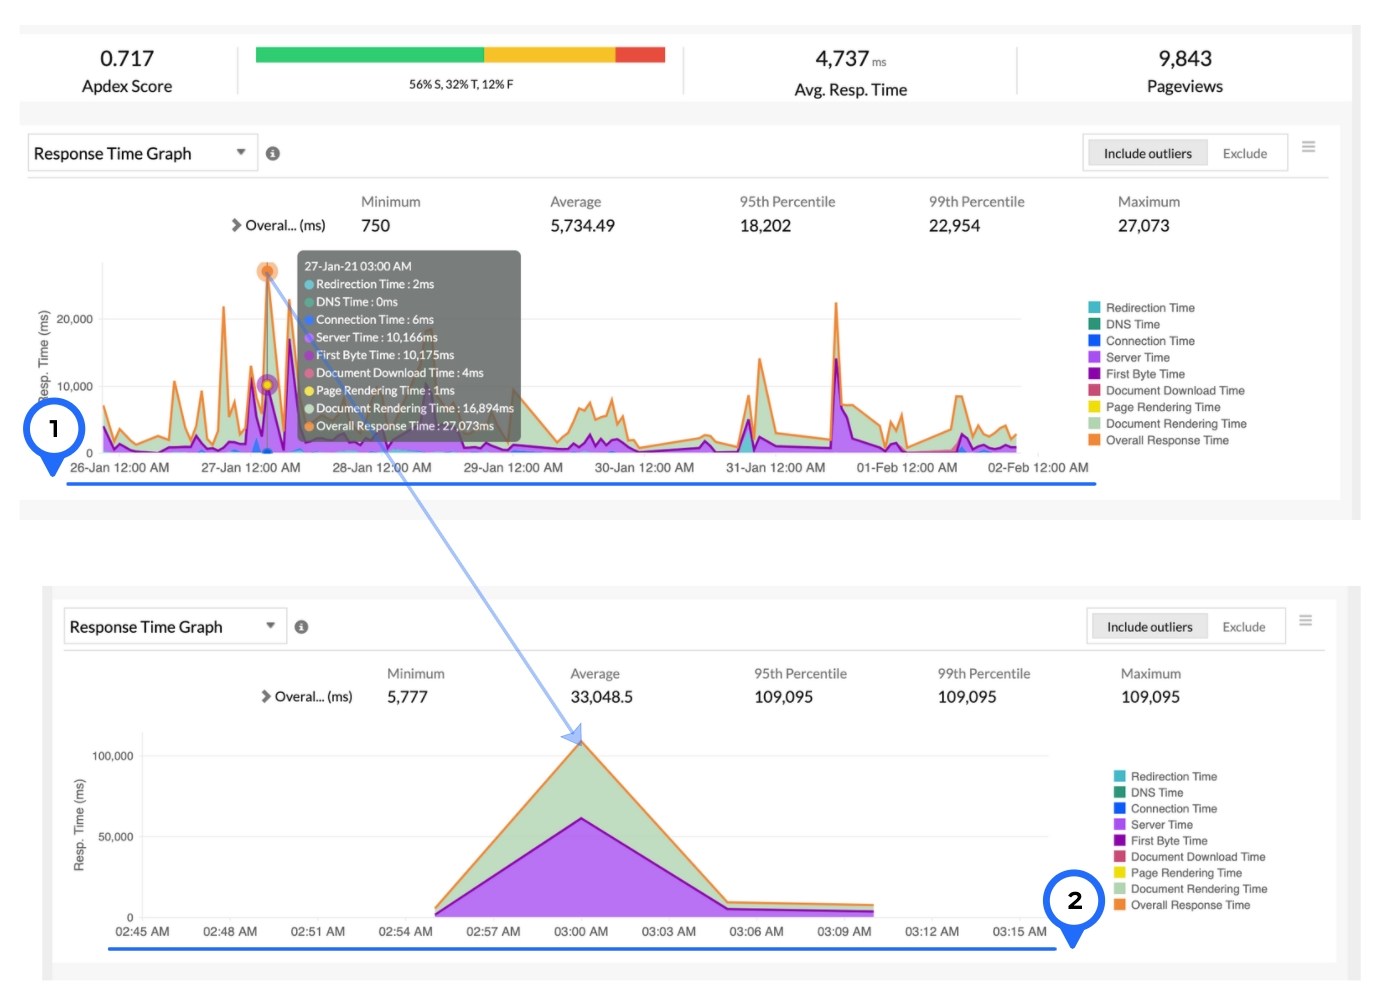
Figure 2: Click on a particular point to inspect further.
Figure 2 shows data for one week, ranging from Jan. 26, 2020 to Feb. 2, 2020. Upon clicking the response time peak that occurred on Jan. 27, we can see granular details of the peak for before and after 15 minutes, as shown in Figure 3.
Use case:
Let's analyze the website performance in the last 30 minutes.
In the figure below, it is evident that there is a response time spike. Let's drill down further to inspect this.
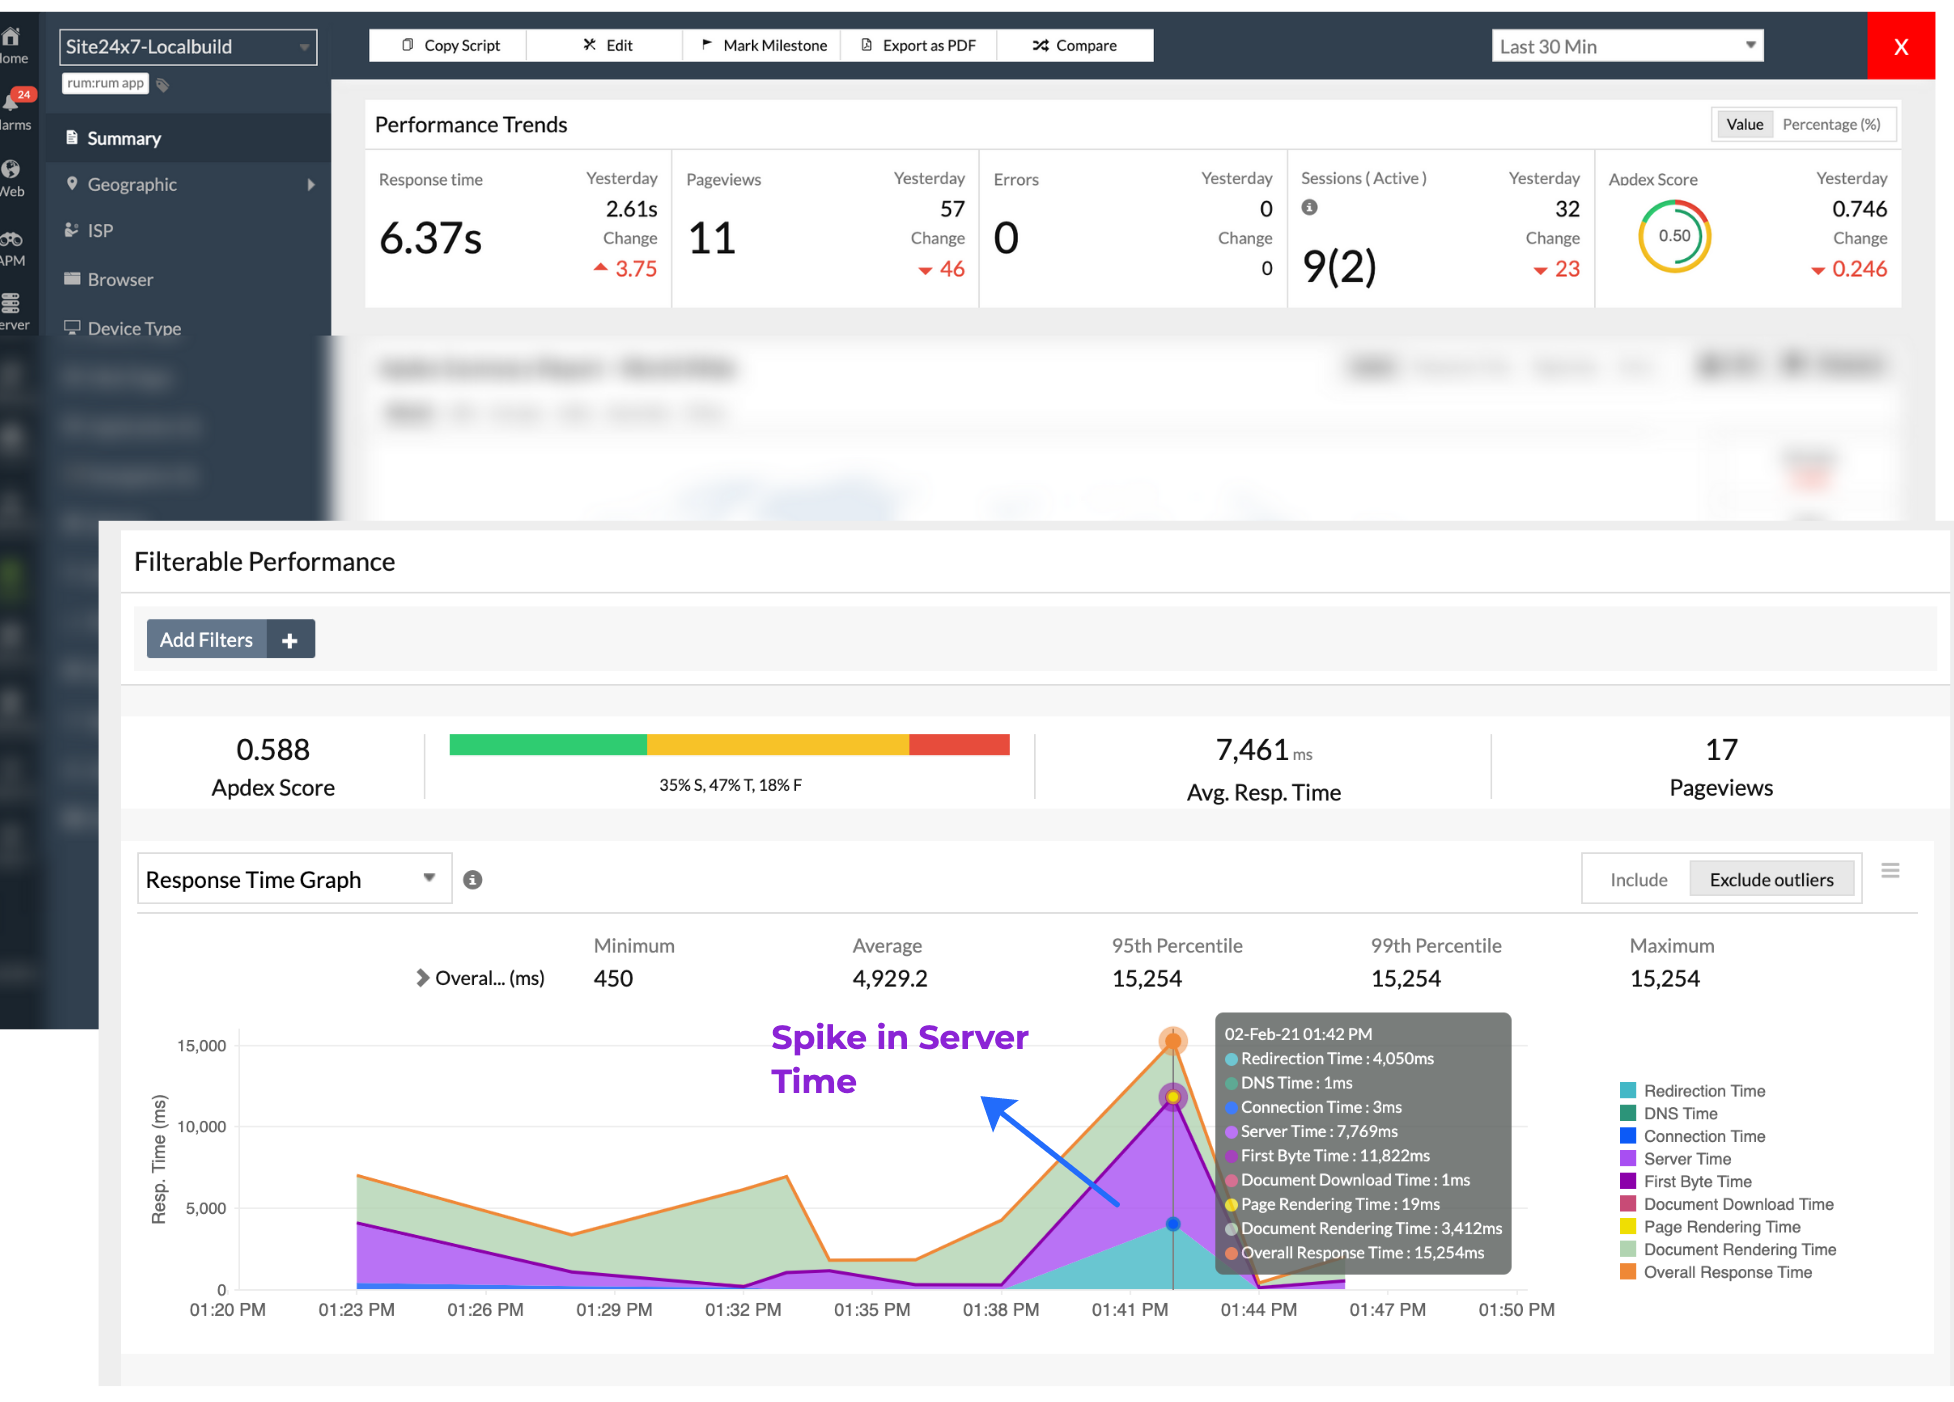
Figure 3: Spike in server response time
In Figure 3, the Filterable Performance graph shows that the response time spike is due to an increase in transactions or Ajax calls, a specific server issue.
Let's navigate to Web transactions, and filter based on transaction with highest response time.
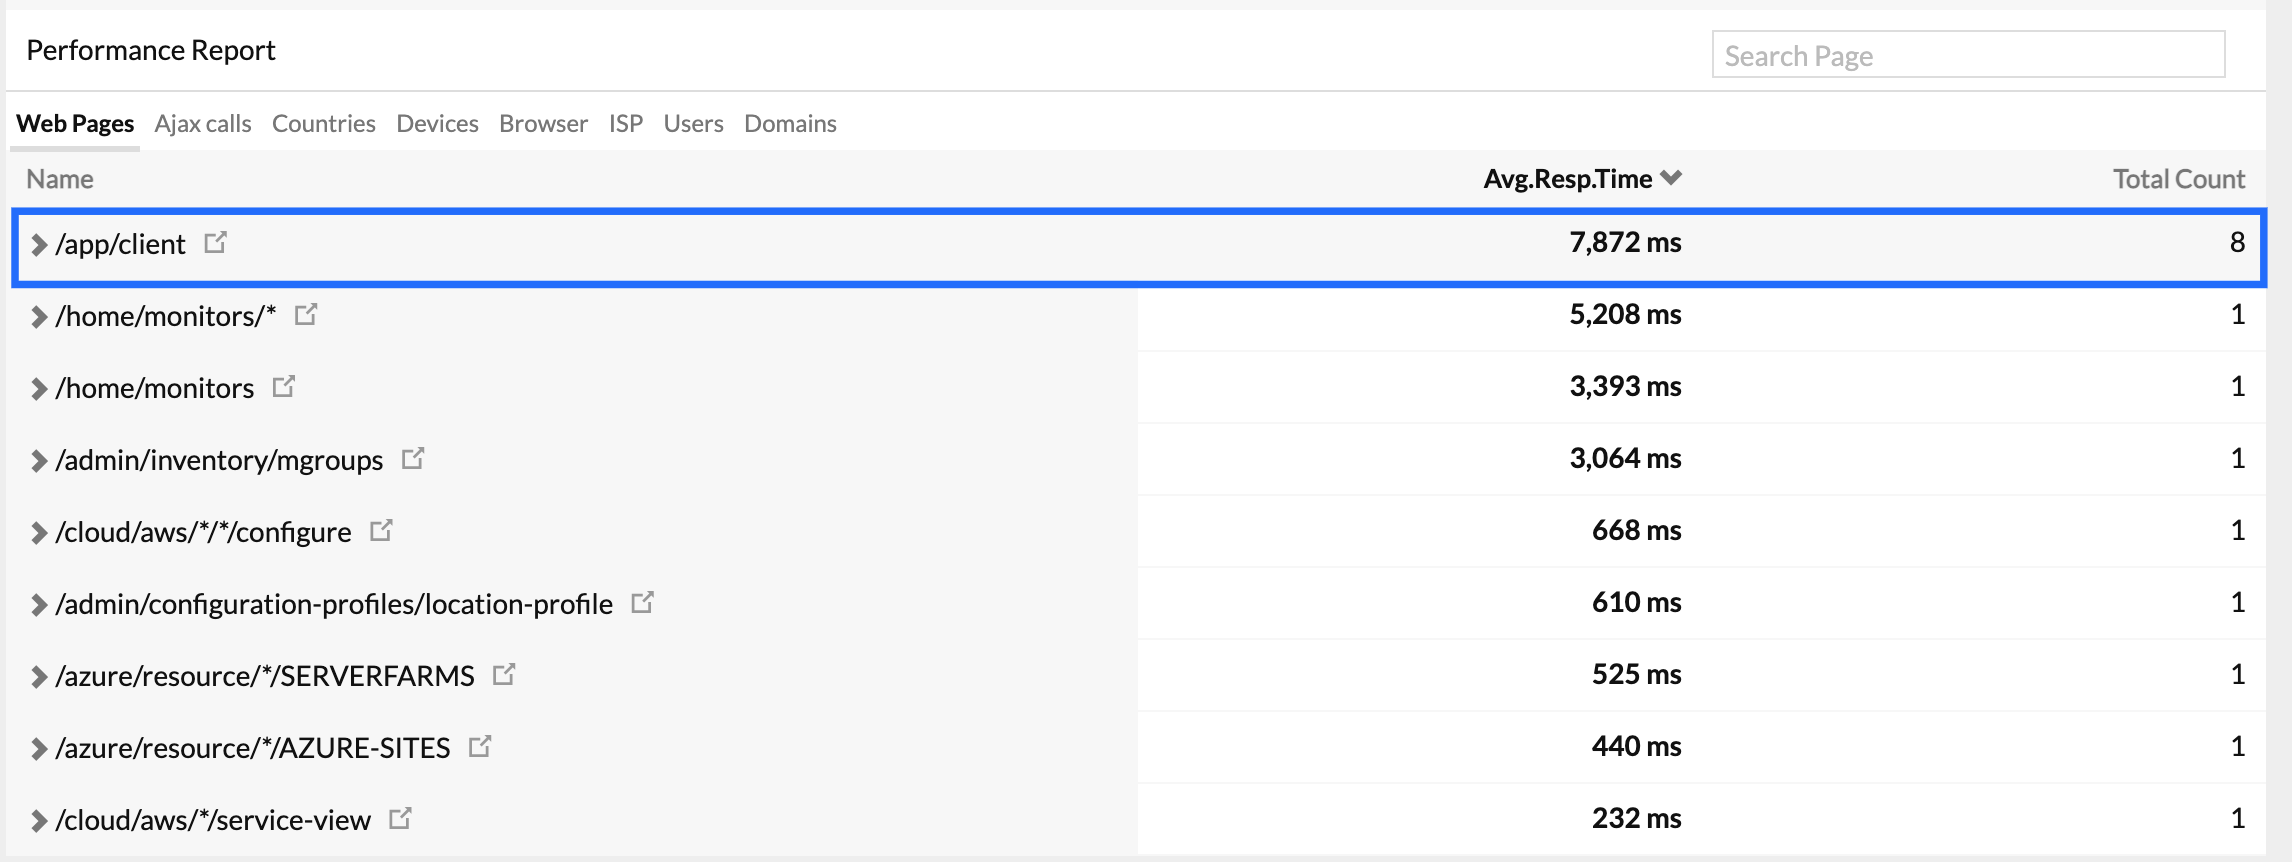
Figure 4: Transactionresponsible for server time spike.
In Figure 4, we see the result: a list of all the similar transactions. This particular transaction, /Home/monitors, has taken more time to process, and the result is a response time spike.
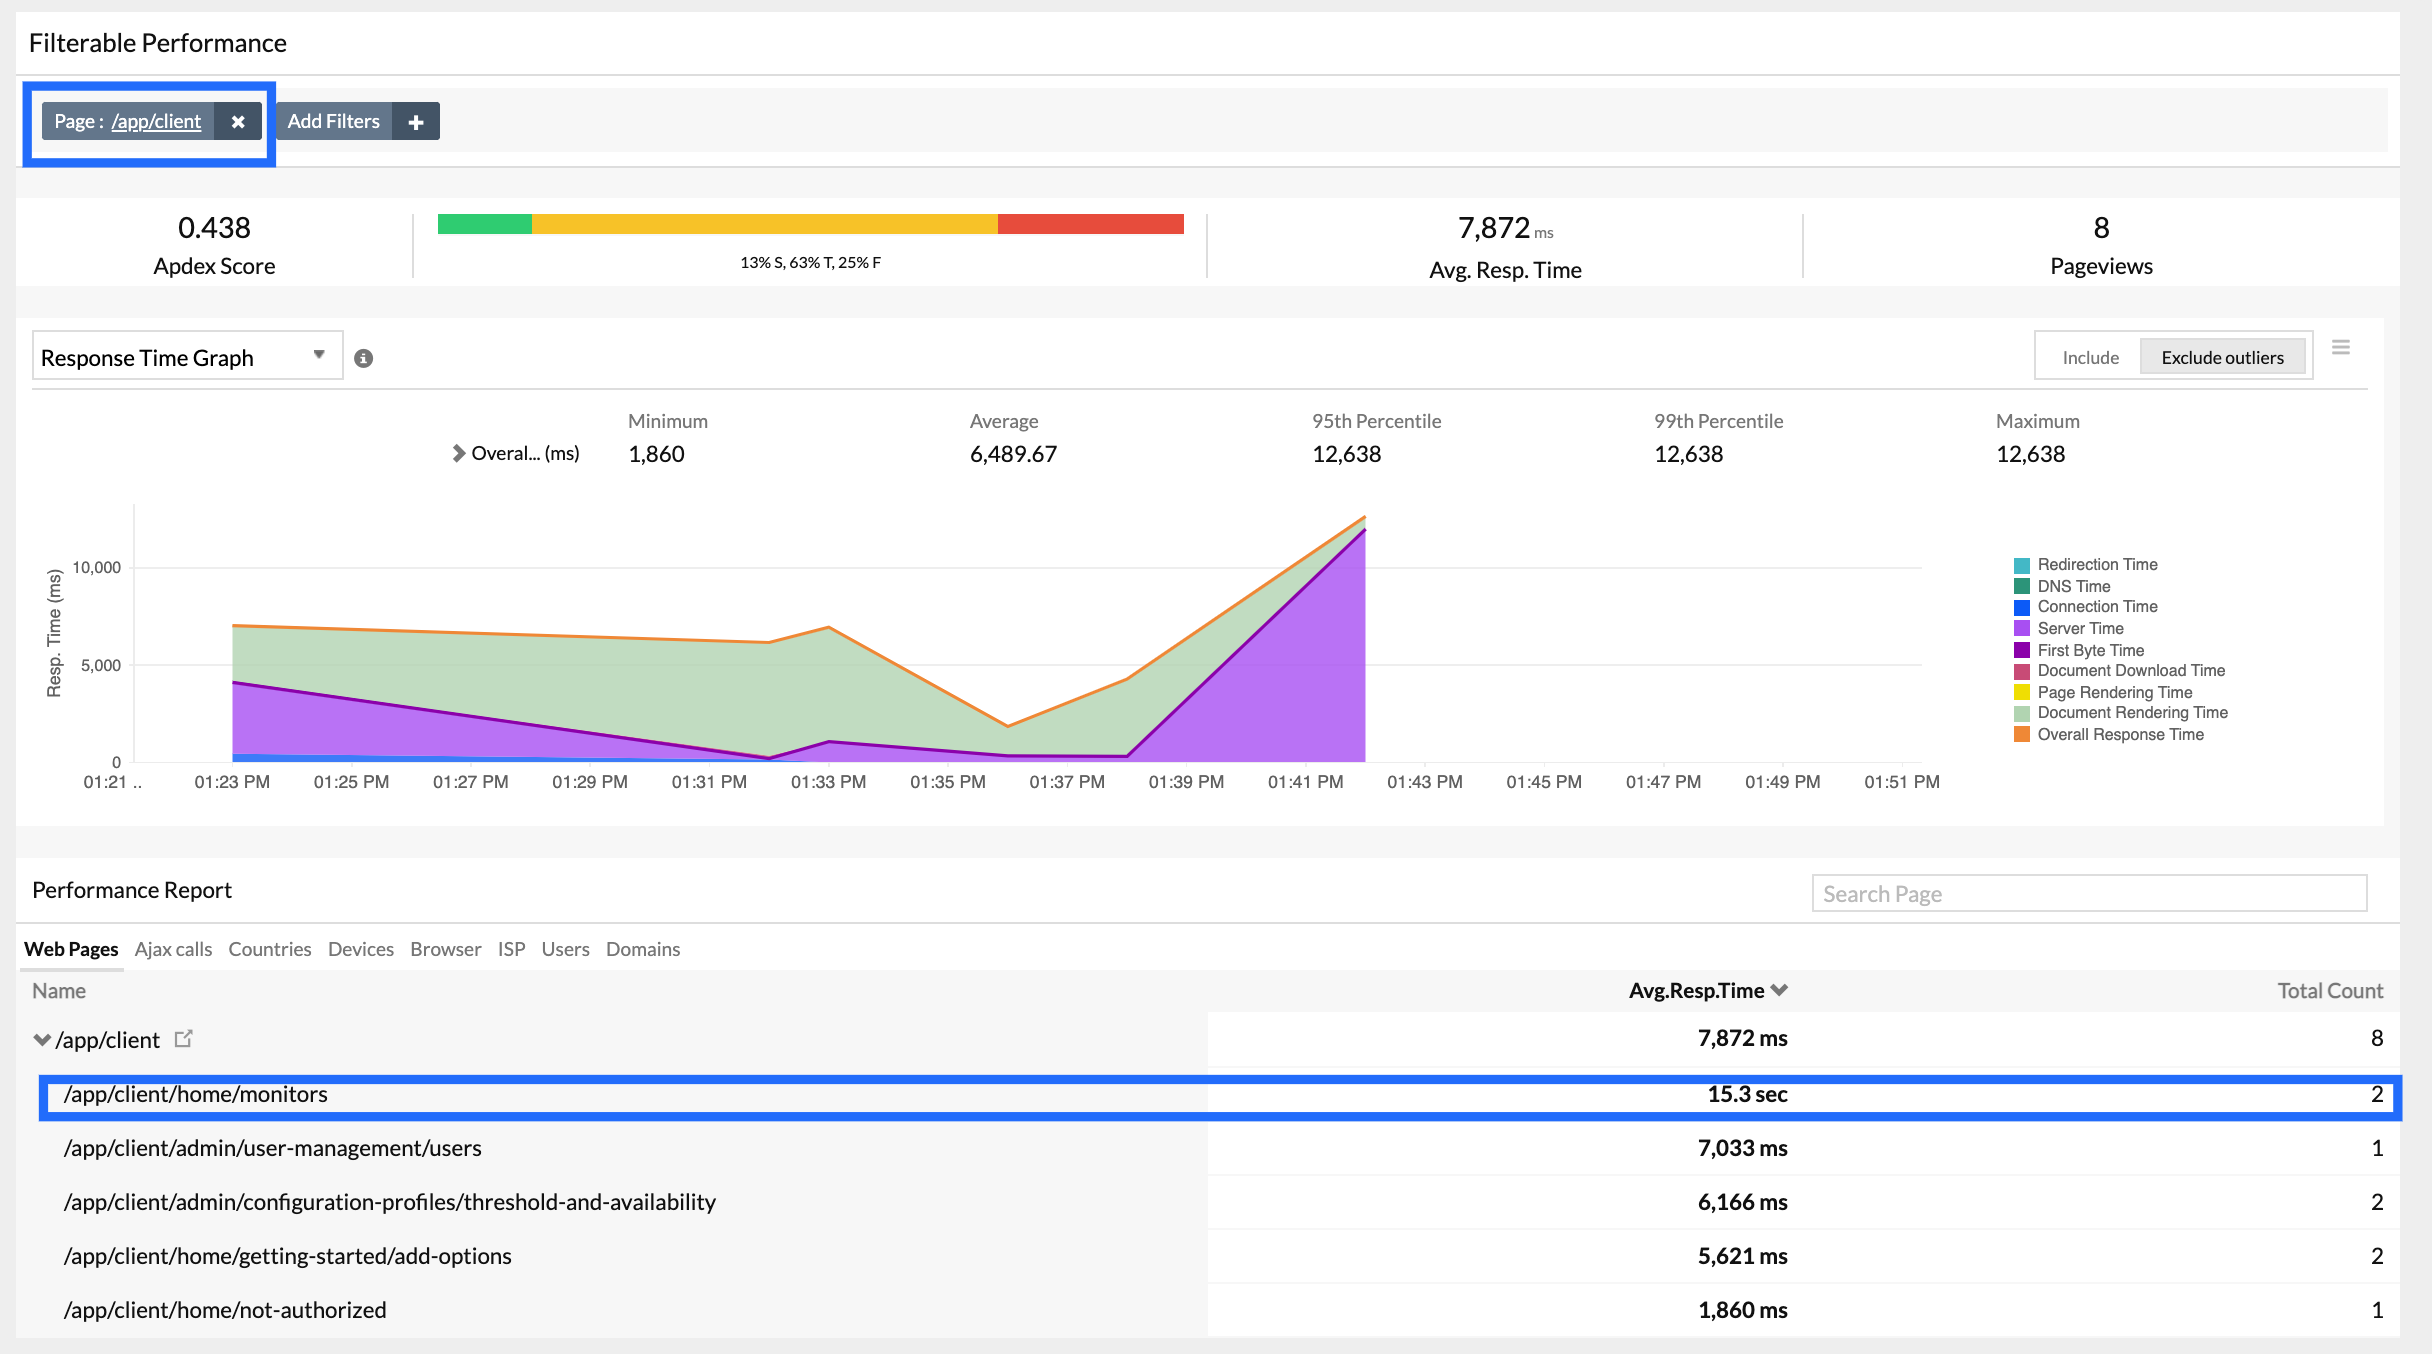
Figure 5: Similar transactions responsible for server time spike.
-
On this page
- Video
- To filter and analyze your website performance
