Mobile vitals
Mobile vitals in Site24x7 are performance metrics that track the time it takes for an app to launch and any slow or frozen frames that users may encounter. These metrics offer valuable insights into the responsiveness, stability, and resource consumption of your mobile application. They help you identify and prioritize important performance issues, allowing you to trace problems back to their source for quicker resolution.
Currently, Site24x7's Mobile APM measures the App Start Time, Slow Frames, and Frozen Frames.
App Start Time
The App Start Time refers to the time it takes the application to launch.
Why should you track the app launch time?
Ensuring fast launch and load times for your app is vital for a good user experience. If the app is slow, users will notice and not be happy. The launch speed of your app reflects its overall quality and how quickly users can interact with it.
There are two ways to launch an app: a cold start and a warm start. Minimizing the time both take is crucial for the user experience. Site24x7 lets you keep an eye on these two metrics, so that you can enhance your app performance.
Cold starts
A cold start is when an app starts completely from the beginning. This occurs when the system hasn't initiated the app's process until that moment. Cold starts typically take place when a user opens the app for the first time after turning on their device, or closing the app manually. This type of launch is the slowest because there's no preexisting process already running for the app. Minimizing the app launch time usually revolves around addressing cold starts since they are the lengthiest.
Warm starts
A warm start includes some of the operations that occur in a cold start. But it is not as fast as a hot start. There are different scenarios that can be considered warm starts:
- If the user exits your app and reopens it, the app has to recreate some processes from the beginning using a call to onCreate().
- If the system removes your app from memory, and then the user reopens it, the app needs to restart, but it can get some benefit from the saved instance state bundle passed into onCreate().
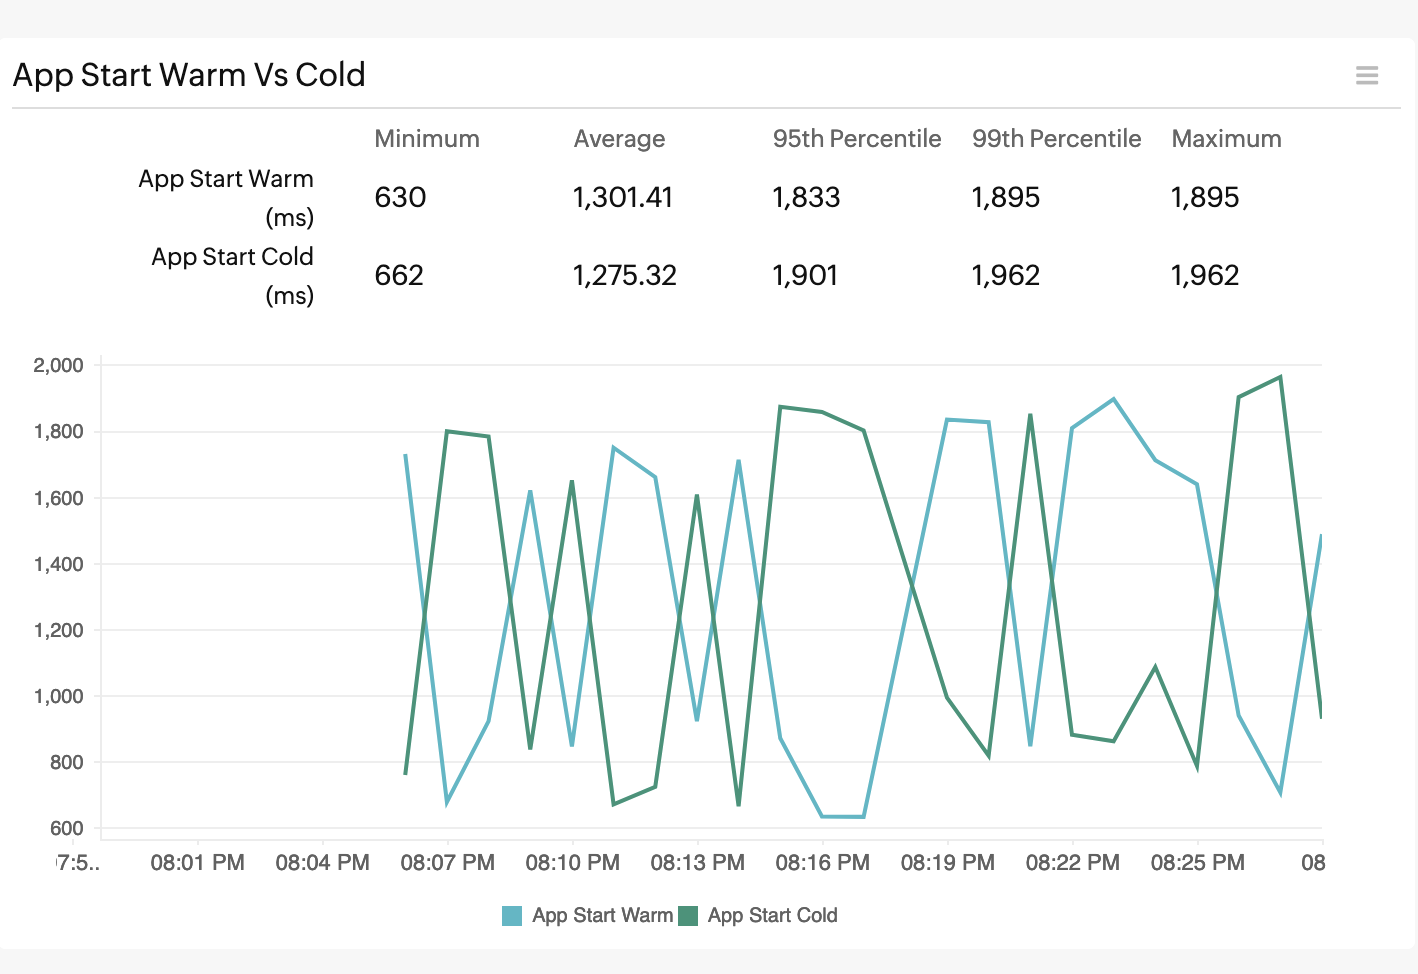
View metrics
You can see the metrics and graphs related to the App Start Time on the Admin Summary tab.
The top band displays the overall App Start Time.

You can also see the App Start Warm Vs Cold graph.
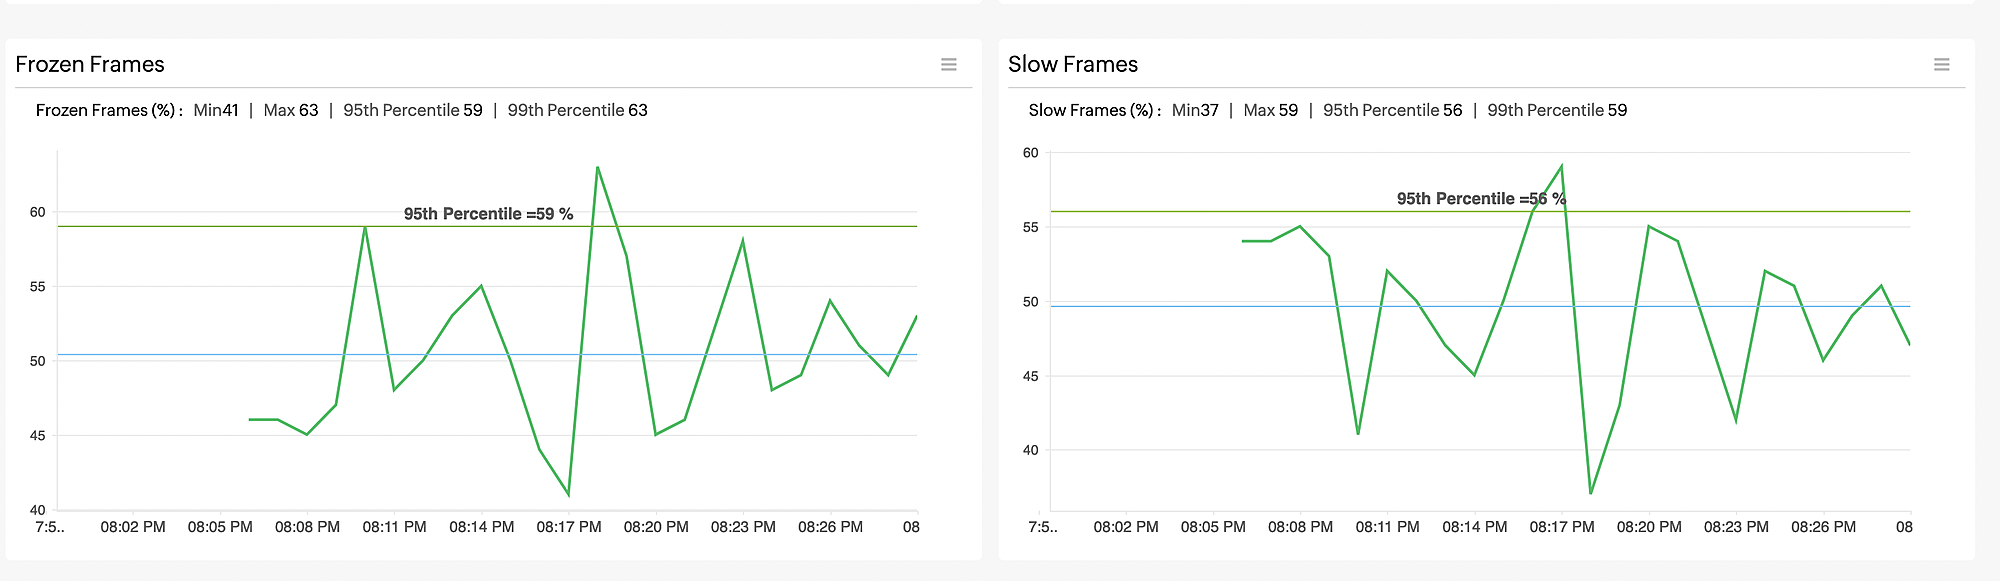
Slow Frames and Frozen Frames
To monitor the responsiveness of the user interface, Site24x7 records the percentages of frozen and slow frames out of the total number of frames.
- Slow frames: Slow frames are frames that surpass the recommended rendering time of 16ms on Android or 16.67ms on iOS, affecting the targeted smooth frame rate of 60fps.
- Frozen frames: Frozen frames refer to frames that exceed a rendering time of 700ms.
View metrics
On the Screens tab, click each transaction to view the graph depicting the percentages of frozen and slow frames out of the total number of frames.