APM Insight and IIS Monitor integration
Introduction
APM Insight monitors application's code level performance details whereas IIS Monitor collects performance details of the overall IIS server and the health of its applications. Integration of these will provide a consolidated view of the IIS server's health and performance bottlenecks.
Prerequisites
- APM Insight .NET agent and/or Site24x7 Windows Agent version 15.0 and above.
- Subscription under Advanced Pack and above
Integration Features
You can seamlessly integrate IIS Monitor and APM Insight to gain a unified view of IIS server health and application performance.
Enable IIS Monitor from APM Insight
To enable IIS Monitor, installing Site24x7 Windows agent is necessary, and as such IIS Monitor comes packed with Server Monitor. To enable this monitor from APM Insight console, follow these steps.
- Login to the Site24x7 Console with your credentials,
- Click on APM Insight tab, and select the application you wish to add IIS data.
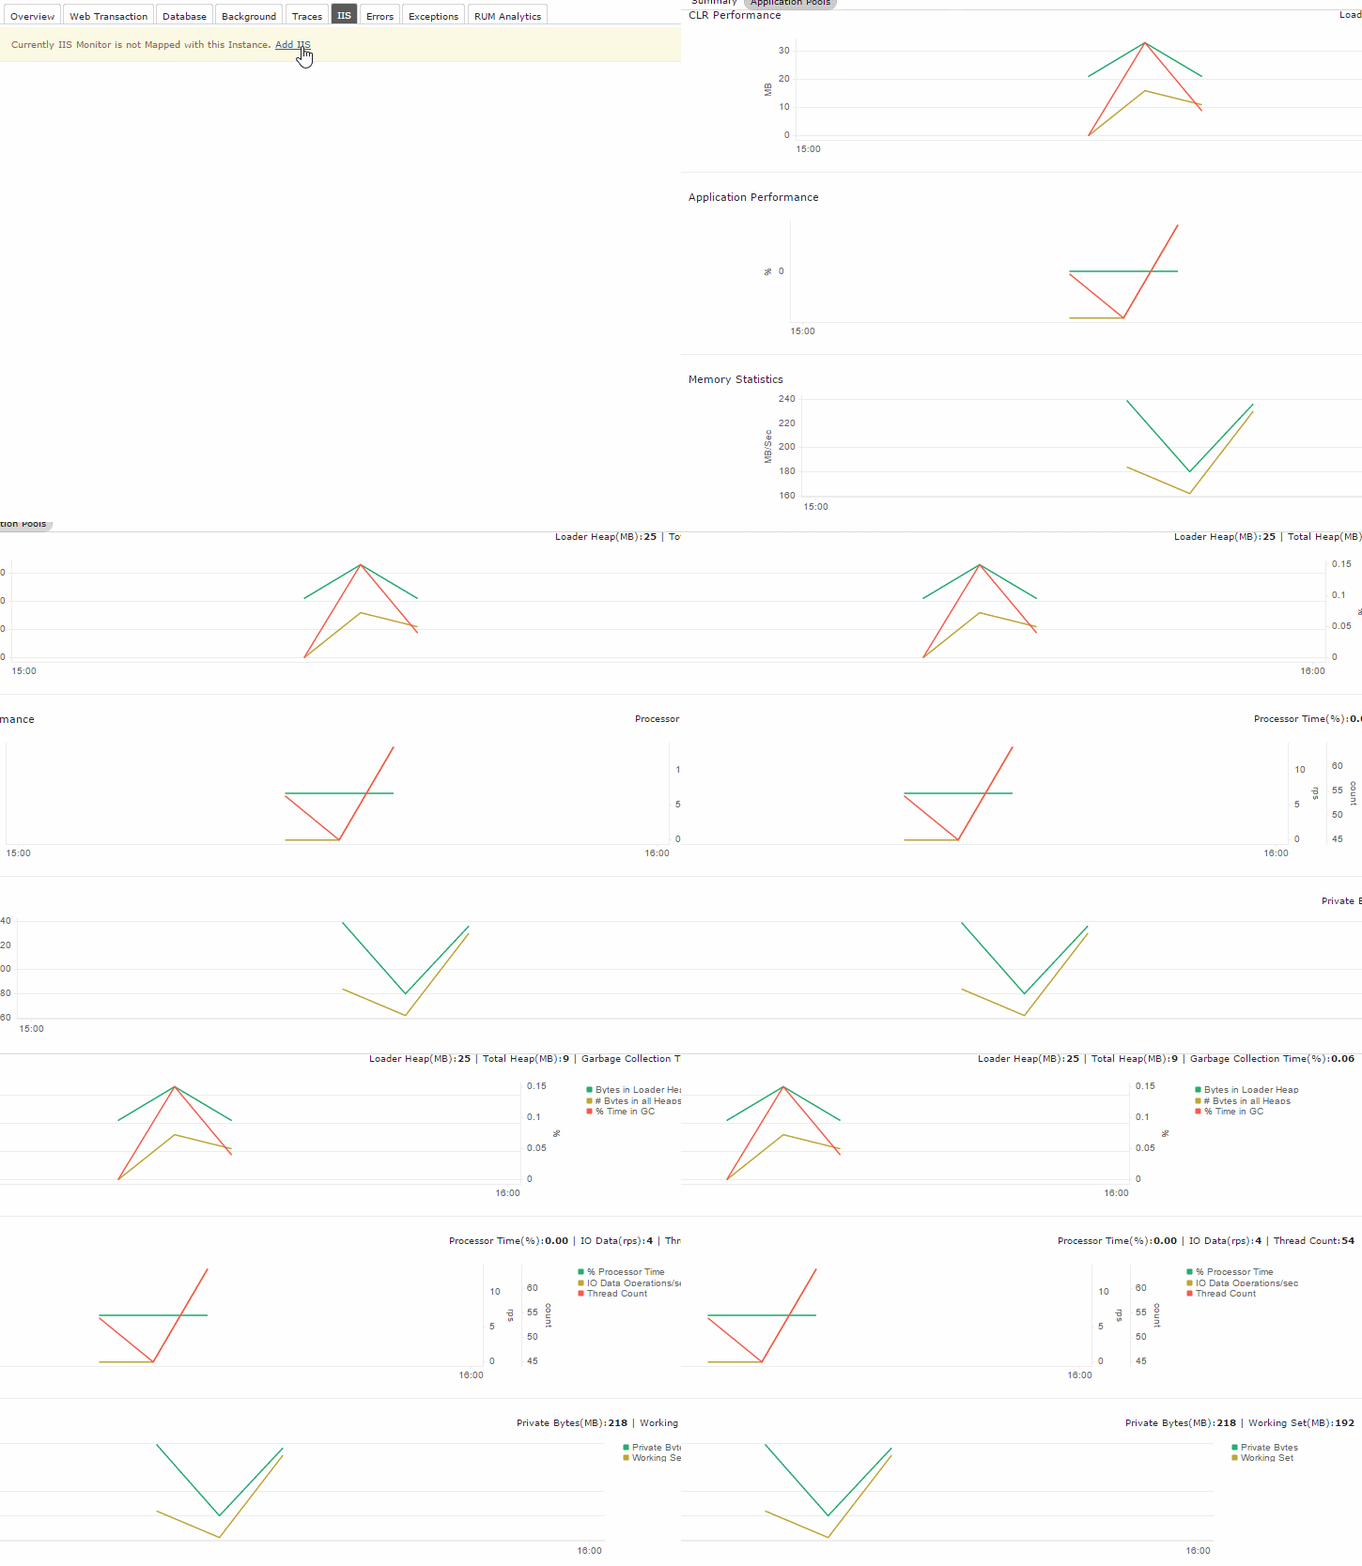
- Click on IIS tab.
- Click on Add IIS Monitor button. This will download and install the Site24x7 Windows agent on the respective server.

Enable APM Insight from IIS Monitor
To enable APM Insight from an existing IIS Monitor console, follow these steps.
- Login to Site24x7 Console with your credentials.
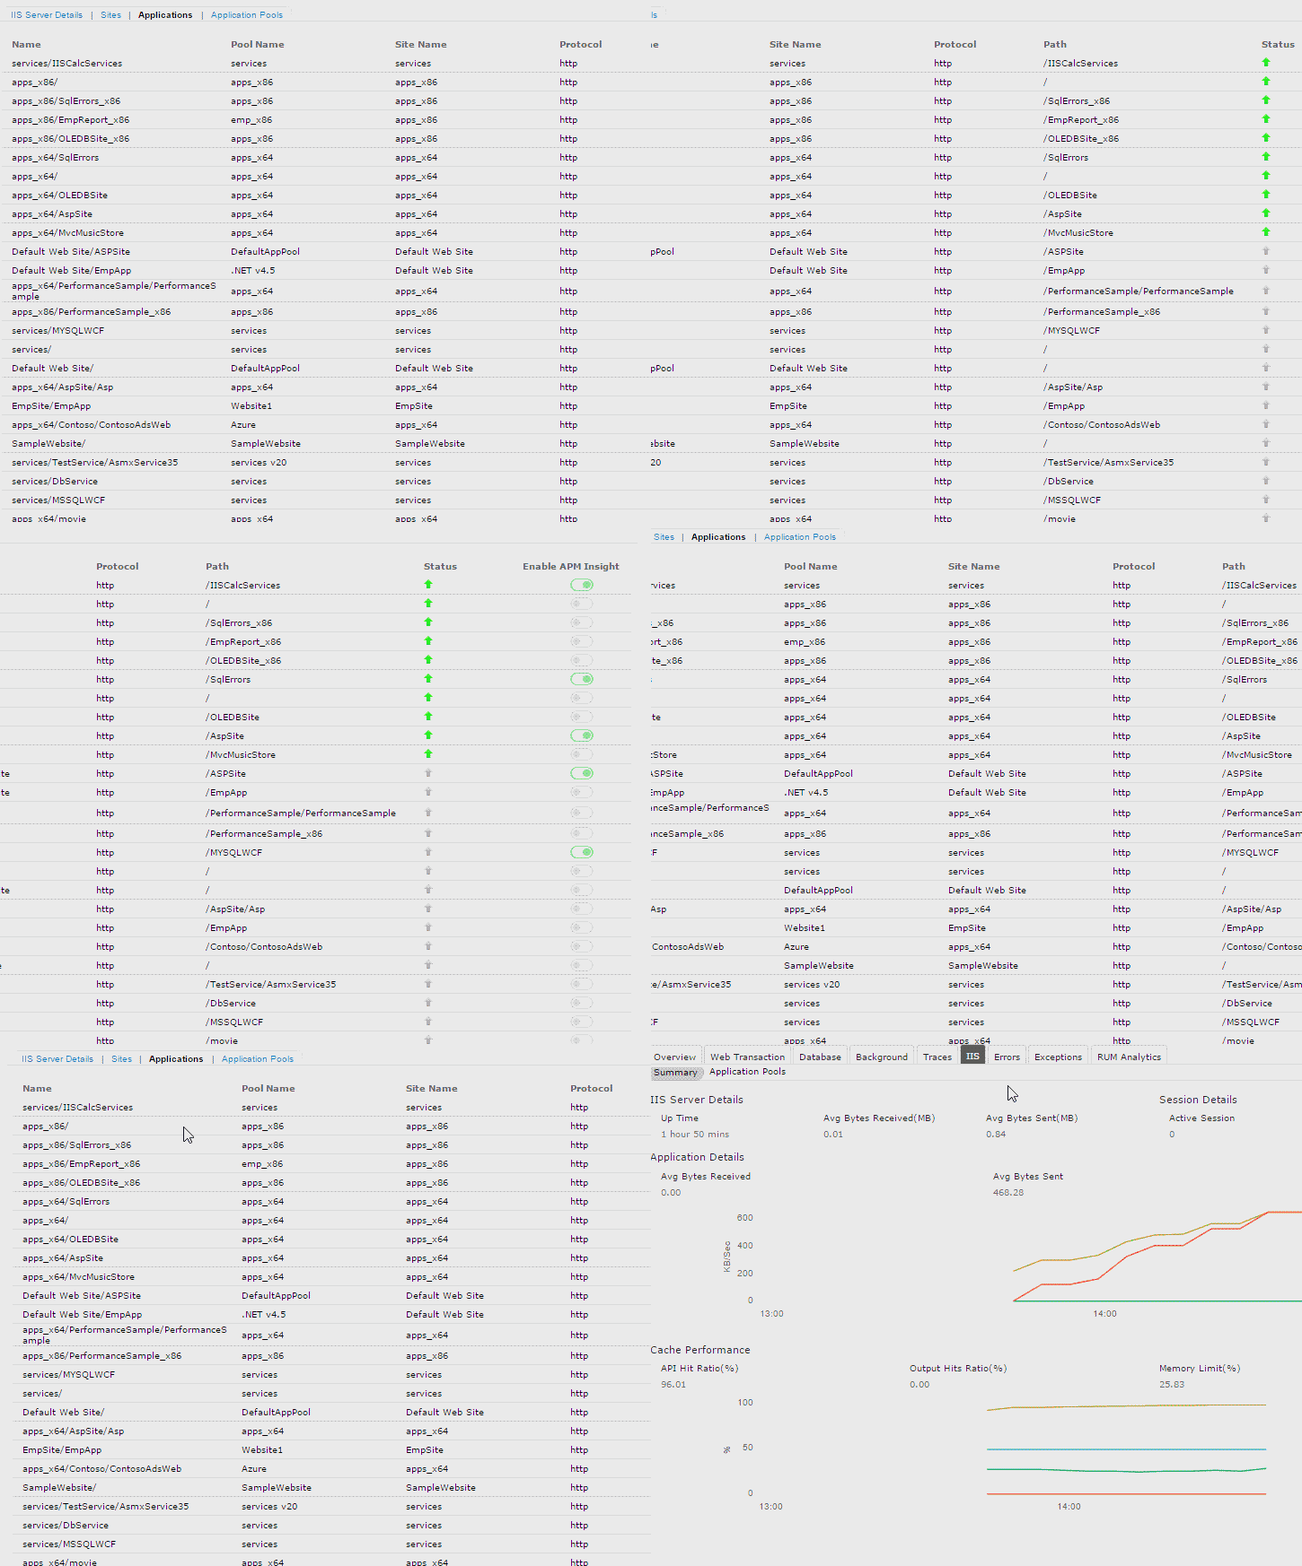
- Click on IIS Monitor, and go to the Applications tab.
- Click on the Enable APM Insight column of the desired application(s). This will download, and install the APM Insight agent, and configure it to monitor the selected application(s).
- Wait for next data collection and refresh the page. When added successfully, the respective application's Enable APM Insight column should be green.

View IIS data from APM Insight
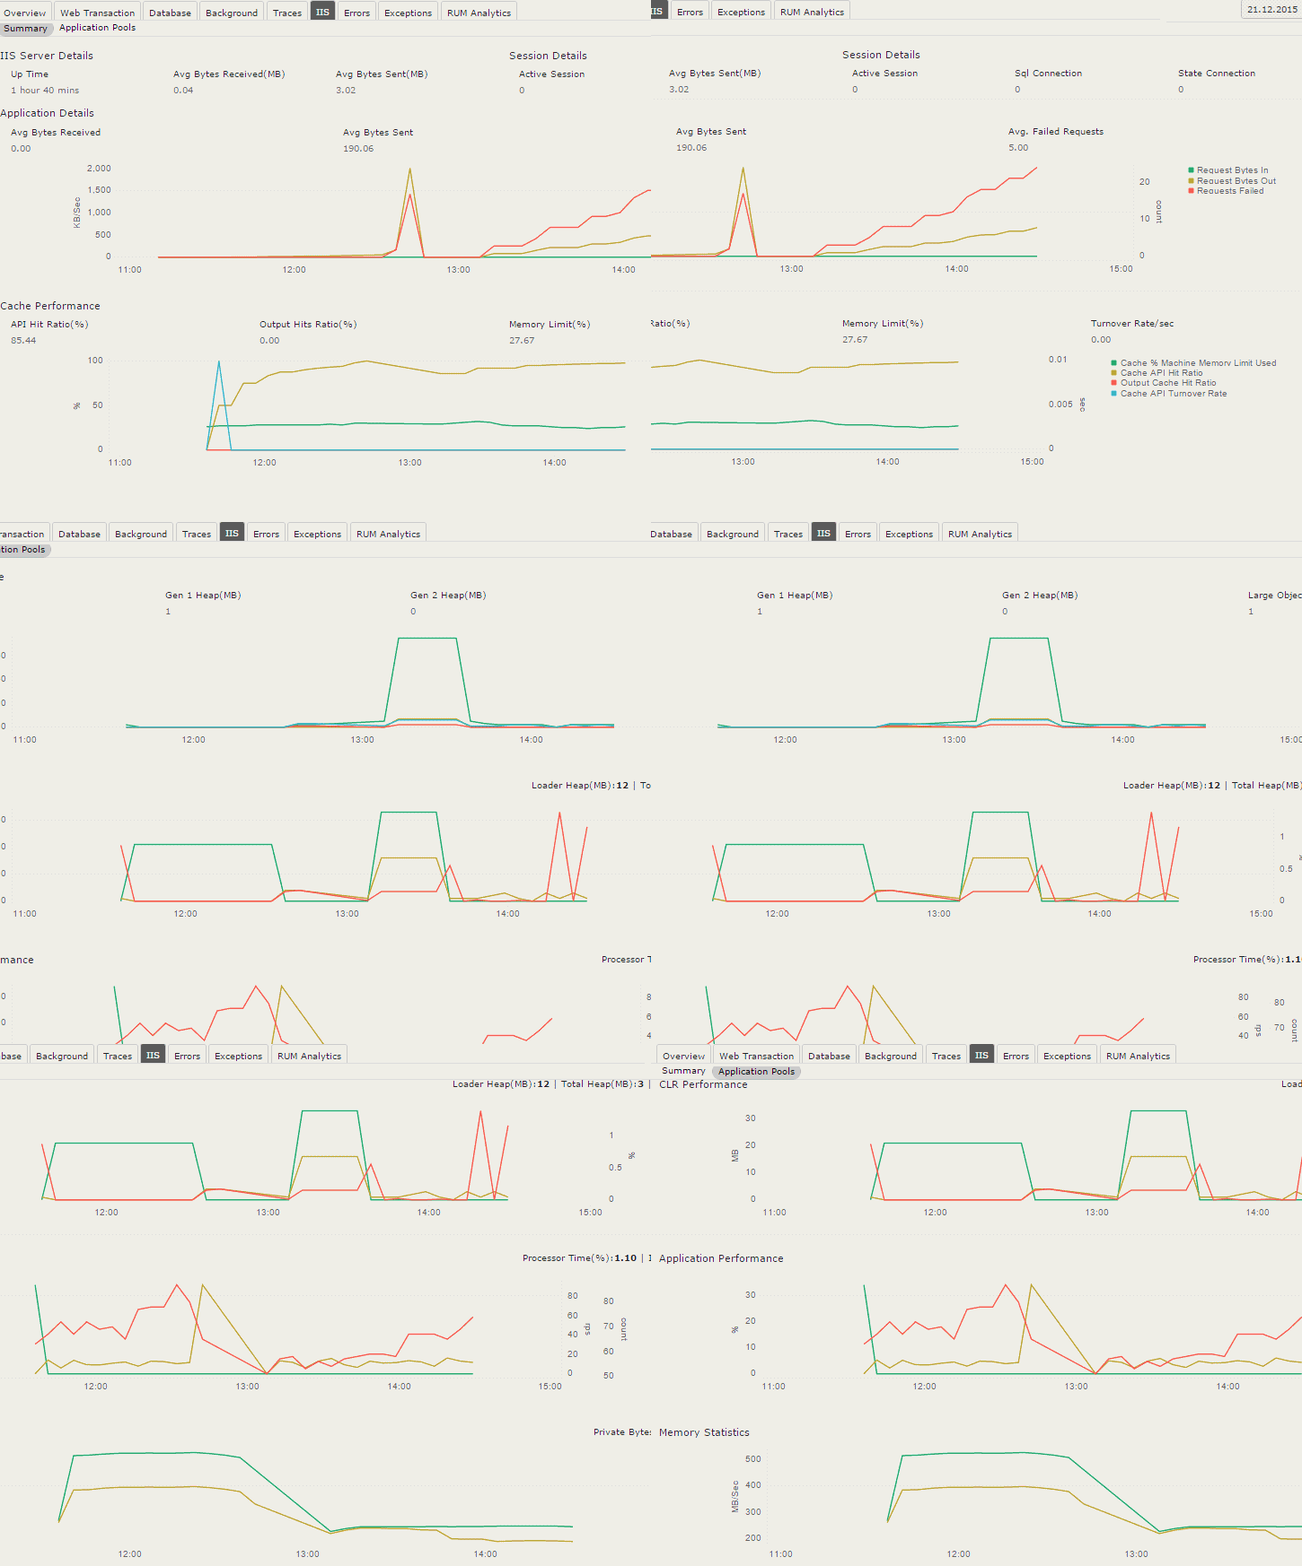
When both IIS Monitor and APM Insight agents are installed and active, the applications in APM Insight page will automatically populate IIS data under the IIS tab. The following performance details can be viewed from within the APM Insight monitor,
- IIS Server details
- Up time
- Bytes sent/received
- Sessions active
- Network statistics
- Bytes sent and received
- # Failed requests
- Cache performance
- API/Output Cache Hit ratio
- Turnover rate
- CLR & Heap performance
- Heap memory used by different generations, G0, 1, 2 and large object heap.
- Loader Heap
- Garbage collection time
- CPU, Memory usage of the corresponding Application Pool
- CPU time
- Memory usage - Private and working set
- Thread count
- I/O operations/sec

Manage APM Insight Status from IIS Monitor
When APM Insight monitor is active, the IIS Monitor's application page will show the status via 'Enable APM Insight' column. Enabling it for the first time, adds the APM Insight monitor for the selected application. Disabling this would suspend the APM Insight monitor, and enabling it again would un-suspend the corresponding APM Insight application.
Enable APM Insight for IIS applications via configuration rules
You can also enable APM applications directly via configuration rules. Learn more.
Frequently asked questions
- Why the data shown under IIS tab is different than the corresponding IIS monitor ?
- IIS monitor data is taken at an average of 5 mins polling interval, whereas in APM Insight data is averaged based on user preference. By default, Last 1 Hour data is averaged and plotted in the graph, which can be changed just like other APM Insight data, by clicking the combo box on the top right of the application page, and selecting the time window.
- Why the "Add IIS Monitor" does not work ?
- This may be due to any of the following reasons,
- The APM Insight monitor is down. Only active applications will be able to trigger agent download. Kindly perform some transactions and retry after the monitor is up.
- The subscription is in Business or lower packs. The IIS monitor can only be added in Advanced pack and above. Kindly upgrade your subscription and retry.
- This may be due to any of the following reasons,
- Why all applications point to the same APM Insight monitor ? Or Why IIS tab not showing data for specific applications ?
- By default, all applications enabled from IIS monitor page for APM Insight monitoring are installed as Muliti monitor. However, if an APM Insight agent is active in the server and configured as single instance, then all applications will be monitored via the same APM Insight application. Thus all applications in IIS would be mapped to the same APM Insight monitor, and IIS tab, would be only showing cumulated data of all applications. To monitor applications individually, select Multi monitor option in APM Insight and restart the APM Insight service.
- Why the agent download fails ?
- The agents for integration needs to be downloaded from our Site24x7 servers, and thus, requires accessibility to the staticdownloads.site24x7.com page. Kindly enable firewall access for the same and retry.
