Log Reports
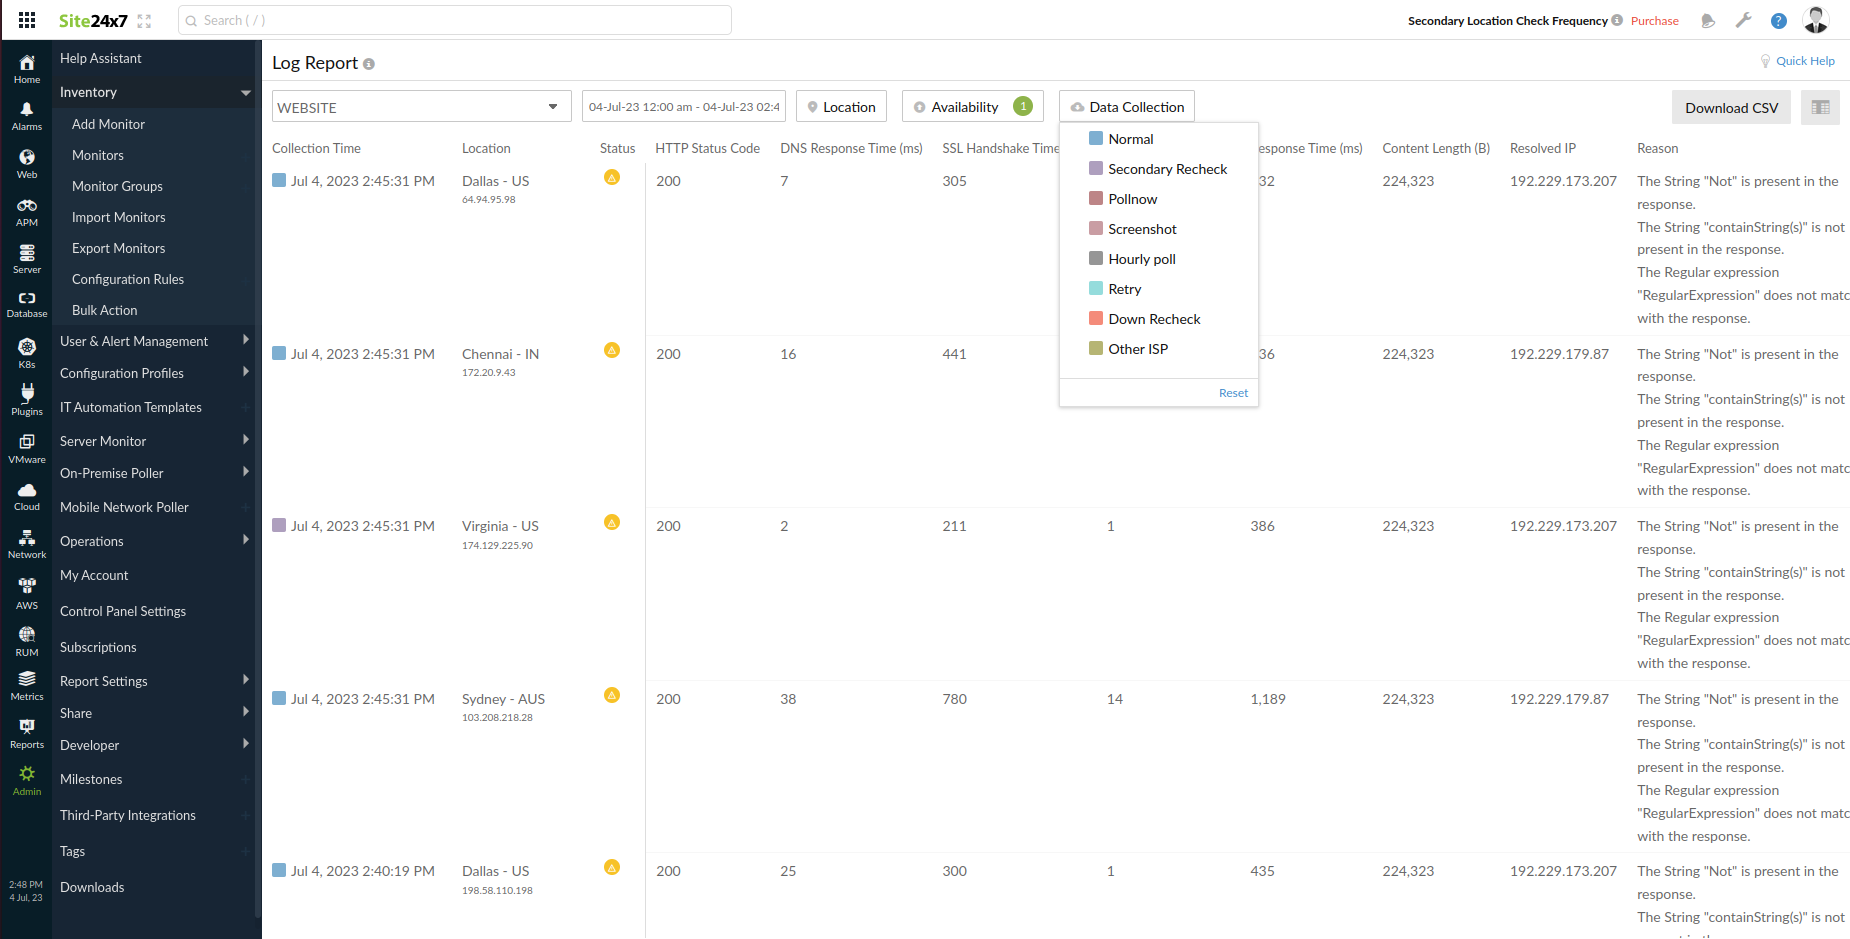
View a detailed log report for the selected monitor and chosen date. Data for a monitor will be available for the last 30 days. All monitor types are supported except for APM and RUM.
Refresh the page manually to get report on the latest polls.
Access Log Report
- Log in to Site24x7 and go to Admin > Operations > Log Report.
- Select the required monitor from the drop-down and choose the dates.
Various logs of that particular monitor for the chosen time period will be displayed. Filter the log report by Location, Availability, or Data Collection. For example, type in Up or Fremont in the search box to filter reports based on the Up status or the location Fremont respectively. Click Download CSV to get the report as a .csv file.
You can customise the columns in Log Report by clicking on the filter column icon on the right end of the filter panel. For example, you can choose to see the columns of DNS Response Time, Connection Time, Content Length, etc. by selecting each of the desired options. Website monitors have five additional filters; ISP Name, Protocol Used, Hash Function, Key Encryption, and Key Exchange. Monitors that do not have their location detail will not have the location column in the display.

