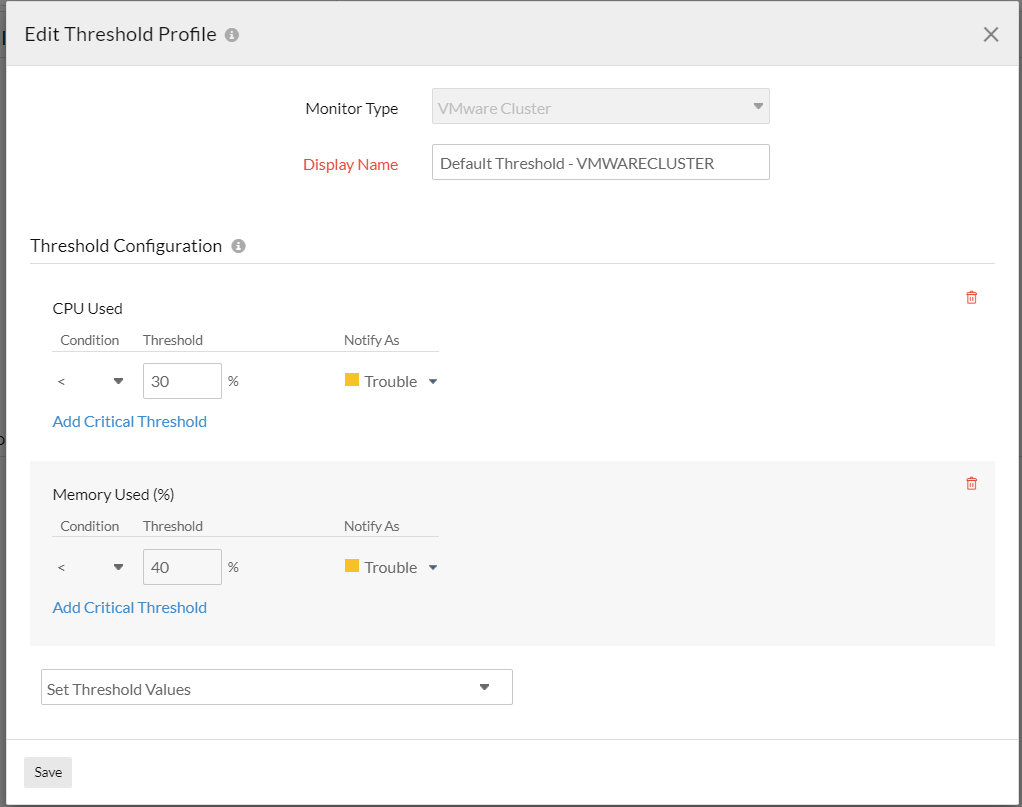
Threshold and Availability for VMware Cluster Monitor
Threshold profiles help the Alarms Engine decide if a specific resource is Critical or in Trouble. After adding a VMware Cluster for monitoring, you can configure thresholds for critical performance metrics and receive alerts that you can use to avoid issues and resolve them instantly.
A default Threshold and Availability profile for VMware Cluster monitors will be automatically listed on the Threshold and Availability screen when you use it for the first time. You can add new ones using the steps below:
Creating a Threshold and Availability profile for VMware Cluster monitors
- Log in to your Site24x7 account.
- Navigate to Admin > Configuration Profiles > Threshold and Availability.
- Click Add Threshold Profile, then click Add Threshold and Availability.
- Specify the following details:
- Monitor Type: Select VMware Cluster from the drop-down list.
- Display Name: Provide a label for identification purposes.
- Set the threshold conditions (<, <=,=,>, or >=) to get the performance metrics and receive alerts if the thresholds are breached. The monitor’s status changes to Trouble or Critical when the threshold condition holds true.
- For VMware Cluster monitors, you can configure thresholds for CPU Used, Memory Used (%), Storage Used, Storage Percentage, Ballooned Memory, Power On VM, Power Off VM, and Suspended VM.
- Advanced Threshold Settings: Set complex alert conditions using logical operators across multiple attributes to detect anomalies precisely using advanced threshold settings.
- Click Save.

Edit a Threshold and Availability profile for VMware Cluster monitors
- Navigate to Admin > Configuration Profiles > Threshold and Availability.
- Click the profile you want to edit.
- Edit the necessary parameters on the Edit Threshold Profile page.
- Click Save.
Delete a Threshold and Availability profile for VMware Cluster monitors
- Navigate to Admin > Configuration Profiles > Threshold and Availability.
- Click the profile you want to delete. This will direct you to the Edit Threshold Profile page.
- Click Delete.
