Database Monitoring

Assess the operational status of your database system holistically. Leverage cross-stack observability to trace performance from the frontend down to the database layer, accelerating troubleshooting and reducing Mean Time to Repair (MTTR) for developers and DBAs alike.

Feature overview

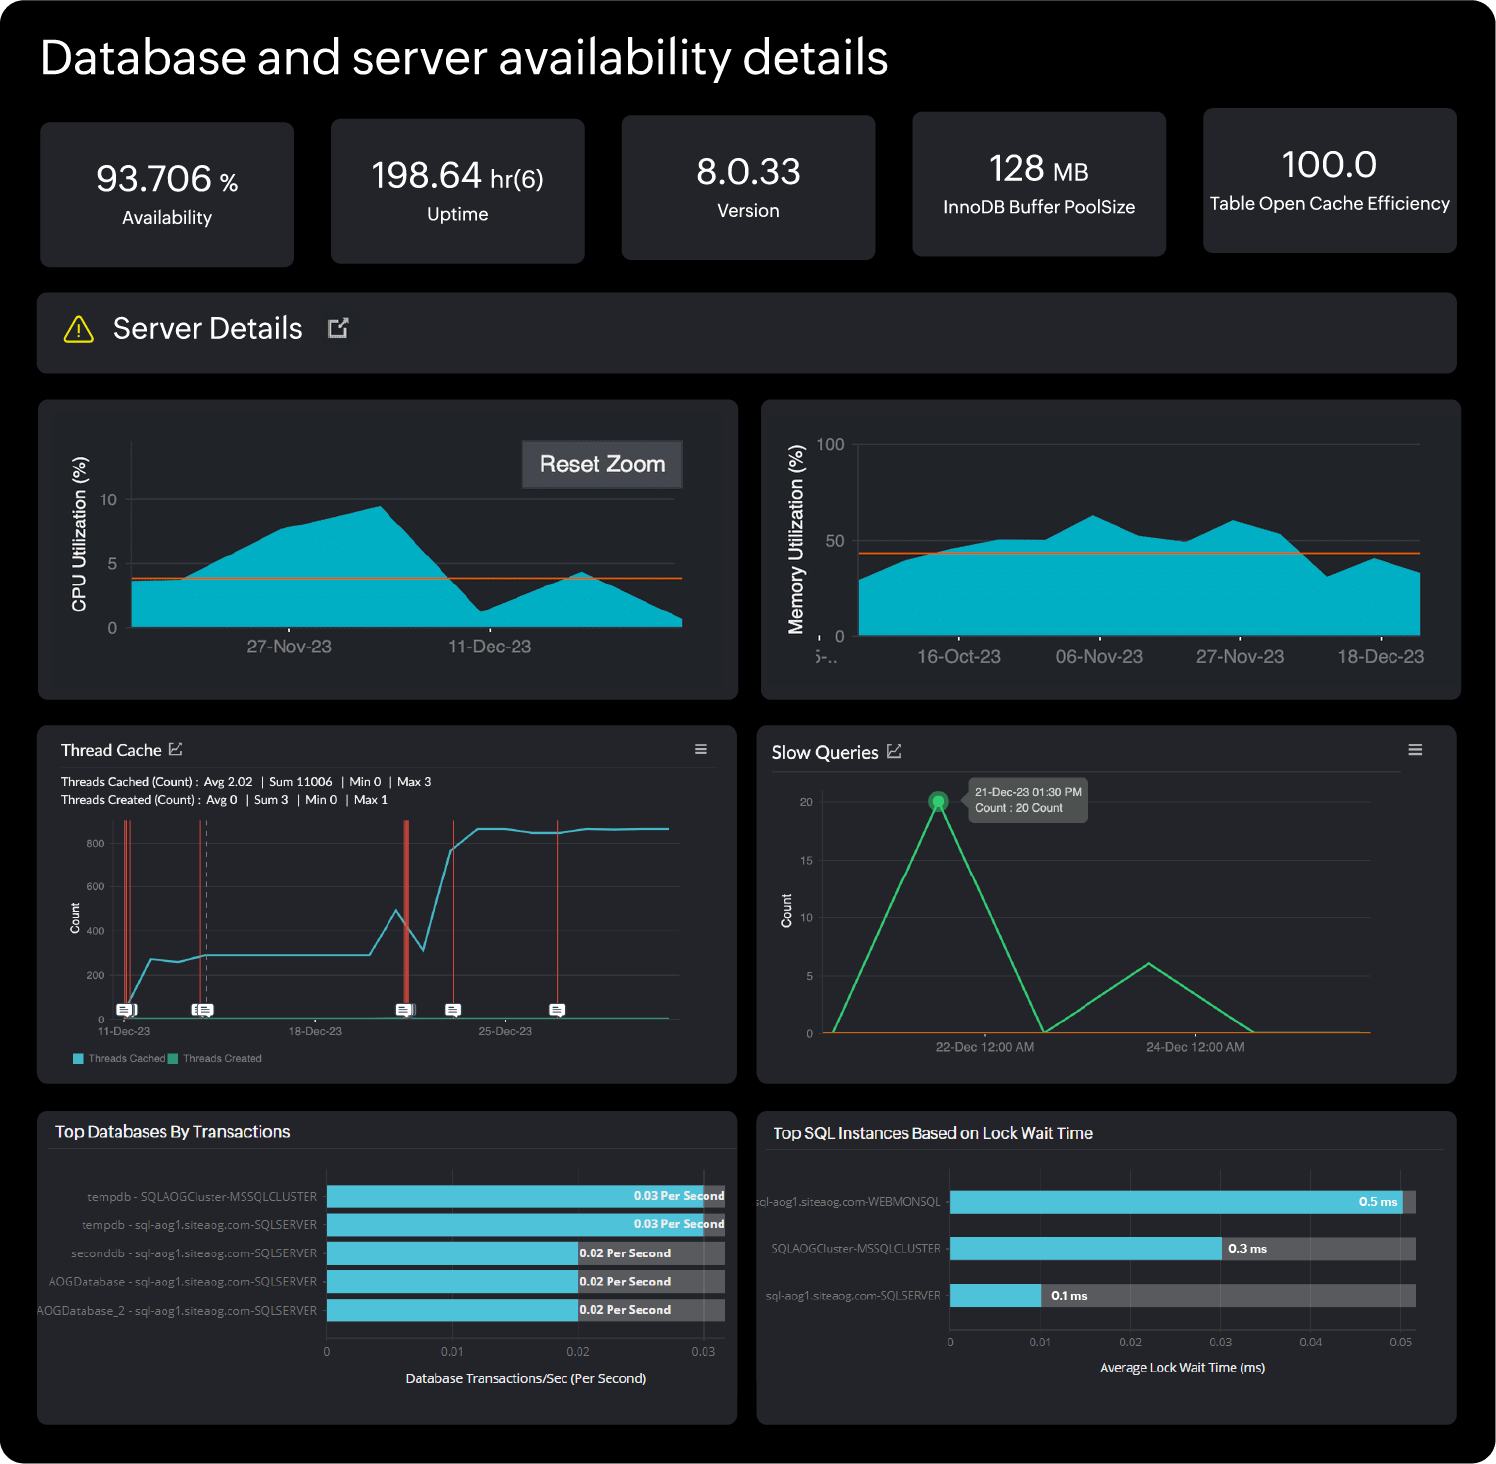
Achieve real-time database monitoring with clear visibility into availability, performance, and resource usage. Leverage AI-powered anomaly detection to establish dynamic baselines and receive proactive alerts before issues impact users, significantly alleviating manual DBA workloads. Detect slow queries, lock contention, and resource bottlenecks with accurate, noise-free alerts. Dive deep into technical metrics like the MySQL InnoDB buffer pool size and PostgreSQL dead tuples to pinpoint specific inefficiencies. Scale confidently with unified monitoring that adapts to growing database workloads and environments.

End-to-end database monitoring tool

Database monitoring tools give you a panoramic view across SQL, NoSQL, Oracle, and other multi-vendor databases, on-premises, or hybrid setups to ensure high availability. Pinpoint and resolve slow response times, load times, and requests with an AI-powered database monitoring tool. Empower both developers and DBAs with cross-stack observability, correlating database query performance directly to application behavior and end-user experience to drastically reduce MTTR.

Health Availability Database

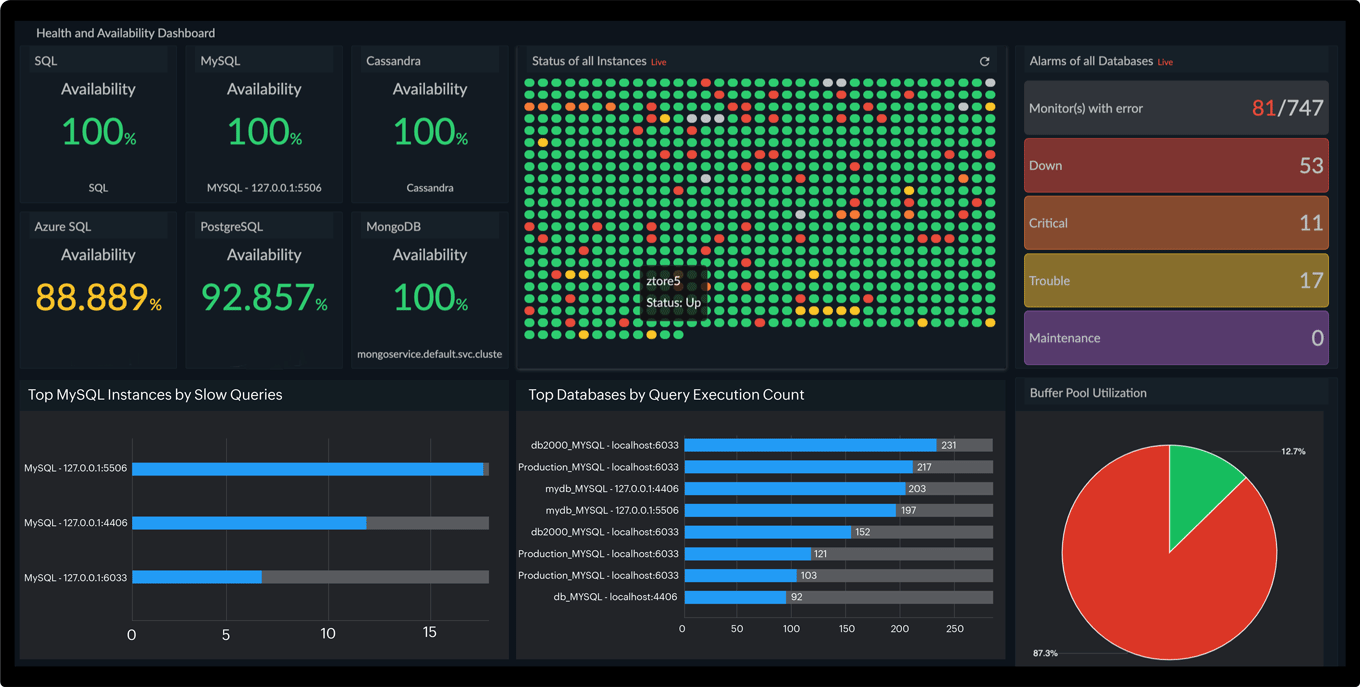
Auto-discover and visualize metrics to determine database health and availability

  • tick white

    Aggregate siloed data into a holistic dashboard and get a complete host-level and query-level overview of all the nodes in your cluster.

  • tick white

    Reduce downtime and provide continuous access to the database for optimal application service.

  • tick white

    Mitigate failover between the active and passive nodes by arranging a single view for your entire cluster.

  • tick white

    Eliminate the pain points and ensure business continuity by tracking database metrics for availability and performance.

Monitor heterogeneous databases from all your hybrid environments in a single console

  • tick icon

    Correlate and identify issues in your relational and non-relational databases in the cloud as well as on-premises setups by visualizing query statistics in a single pane.

  • tick icon

    Manage and monitor a diverse array of databases, including relational databases, like Oracle DB, MSSQL, MySQL, PostgreSQL, and SAP HANA, NoSQL databases, like MongoDB and Cassandra, and in-memory databases, like Redis, in a unified console.

  • tick icon

    Enhance interoperability by understanding unique metrics and KPIs related to each database system for comprehensive visibility.

Monitor heterogeneous databases

Analyze and troubleshoot essential query attributes for operational efficiency

  • tick white

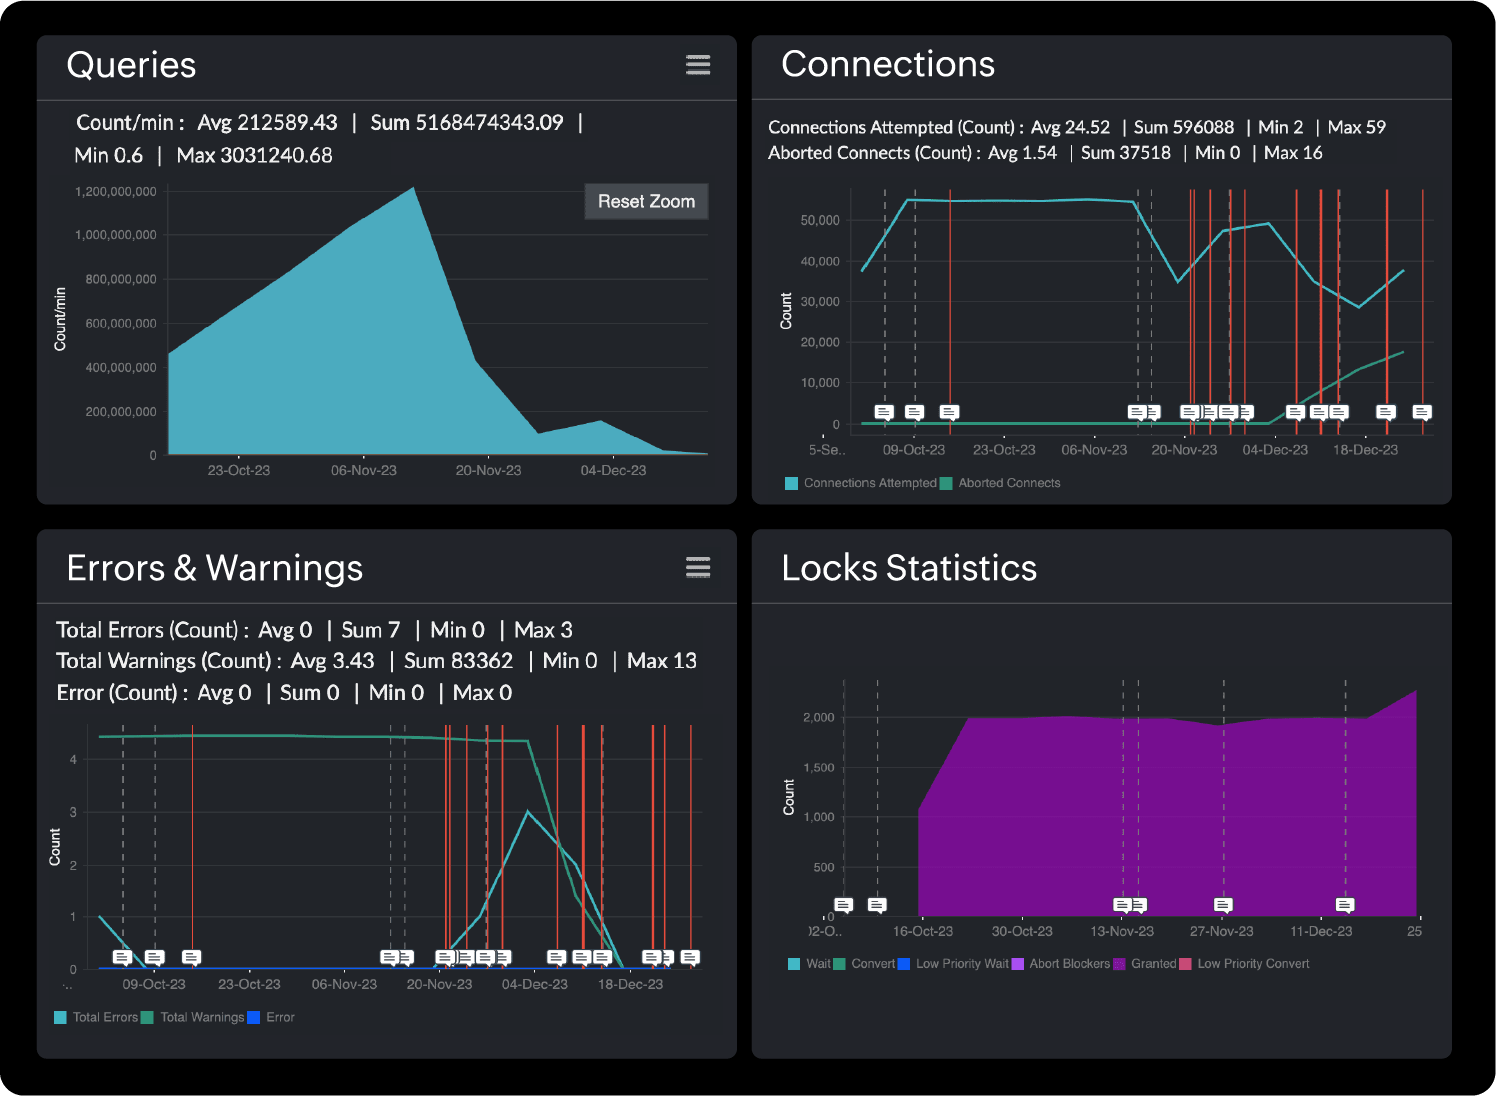
    Perform comprehensive wait-time analysis to identify the exact cause of database delays. Obtain in-depth query insights based on total time consumed, throughput, and errors to dramatically reduce MTTR.

  • tick white

    Troubleshoot query execution lags . Drill down into execution paths and isolate slow queries that exceed configured thresholds for rapid root-cause diagnosis.

  • tick white

    Improve query execution times by assessing locks and blocking issues, detecting hotspots, and pinpointing query patterns that hinder your databases' performance.

Query Attributes

Gain actionable insights to improve your database performance

Analyze trends and performance outliers with expansive reports

Visualize current and historical resource usage to plan capacity

Frequently asked questions about database monitoring tools

What is a database monitoring tool?

A database monitoring tool is a software solution that tracks the performance, health, and availability of your database infrastructure. It helps DBAs and developers detect slow queries, analyze wait times, and monitor system resources (CPU, memory, I/O) to ensure optimal application performance and prevent database bottlenecks.

How do database monitoring tools reduce Mean Time to Repair (MTTR)?

By utilizing AI-powered anomaly detection, comprehensive execution plans, and wait-time analysis, these tools alert you to lock contentions or inefficient queries before they impact end-users. Access to detailed root-cause data eliminates guesswork, enabling teams to restore normal operations rapidly and lower their overall MTTR.

Looking for assistance? We’re here to help!

Want to learn more?

  • Personalized product demo
  • Proof of concept for set up
  • 30-day, unlimited, free trial
Request a Demo

Interested in our services?

  • 24/5 customer support
  • Flexible and competitive pricing
  • Better ROI
Get quote